Repository navigation
cache: improve metrics accuracy and storage observability - #4369
larry-dalmeida wants to merge 7 commits into
Conversation


Implements fine-grained observability for cache filter results by HTTP
status code class via ScopedPrometheusRegisterer.

New metrics:
- skipper_cache_result_total{result, code_class} counter
- skipper_cache_lru_bytes{route} gauge

Cardinality bounded: 3 result types × 4 code_class values = 12 series max.
Backward compatible: existing flat-key counters still emitted.

LWSRE-214

Signed-off-by: Larry D Almeida <hello@larrydalmeida.com>
Add comprehensive tests for new labeled cache metrics across all
code_class values and cache result types (hit/miss/stale).
Document new skipper_cache_result_total and skipper_cache_lru_bytes
metrics in operation guide.

LWSRE-214

Signed-off-by: Larry D Almeida <hello@larrydalmeida.com>
…2_get_error

Request()'s Vary-sentinel check ("vary:"+baseKey) was routed through the
regular, metrics-instrumented Storage.Get(). That lookup runs on every
single request, regardless of whether a real cache decision is being
made, so it was counting as a cache outcome on every request -
inflating l1_hit/l2_hit/l2_miss/l2_get_error (plain and labeled) with
internal plumbing noise rather than real caching behavior.

Add Storage.GetSilent(), implemented by both LRUStorage (delegates to
Get - it records no metrics of its own) and L2Storage (shares Get's
logic via a new internal get(recordMetrics bool), skipping only the
outcome-metric calls; L1 write-through warming still runs on a silent
hit, since that's a caching side effect of the read, not an outcome
metric). filter.go's sentinel lookup now calls GetSilent instead of Get.

LWSRE-214

Signed-off-by: Larry D Almeida <hello@larrydalmeida.com>
coalesce() had zero timing instrumentation despite being the thundering-
herd protection point for cold misses. Measure from right after the
singleflight DoChan call to when the result channel yields - near-zero
for the leader (it computes the result itself), the leader's real fetch
time for followers waiting on it. Same MeasureSince/customHistogramM
mechanism as the existing cache.reval_wait_duration/cache.reval_duration.

LWSRE-214

Signed-off-by: Larry D Almeida <hello@larrydalmeida.com>
L2Storage only had pass/fail counters (l2_hit, l2_miss, l2_get_error,
l2_set_fallback) - no timing. Measure the underlying Valkey/Redis
Get/SetWithExpire round-trip directly, on every call including internal
lookups like the Vary-sentinel check, via the existing MeasureSince/
customHistogramM mechanism (same convention as
cache.reval_wait_duration/cache.reval_duration/cache.coalesce_wait_duration).

Verified locally against a real Valkey instance: -enable-l2-cache alone
is not sufficient to exercise this - selectL2CacheClient only runs inside
skipper.go's `if o.EnableSwarm` block, so -enable-swarm is also required
or L2Storage is never constructed and cache() silently falls back to
L1-only. Noted this in the local verification setup's README.

LWSRE-214

Signed-off-by: Larry D Almeida <hello@larrydalmeida.com>
cache.storage_error was a single unlabeled counter incremented from 9
generic call sites in filter.go, none of which know whether f.storage is
LRUStorage (L1) or L2Storage (L2) - backend was unknowable there. 4 of
those 9 (all on the Delete path) could never fire: LRUStorage.Delete
always returns nil, and L2Storage.Delete only ever returns nil to its
caller too (L1 delete always runs after a best-effort L2 delete).

Added IncStorageError(backend, op) -> skipper_cache_storage_error_total
{backend, op}, called from the storage implementations themselves where
backend is actually known: LRUStorage.Set/Get (encode/decode failure),
L2Storage.Set/Get (encode/decode failure), L2Storage.Delete (the real L2
failure, previously only visible as the generic unlabeled counter).
IncStorageError also increments the pre-existing flat cache.storage_error
counter and the labeled skipper_cache_result_total{result="storage_error"}
metric from this one call site, so existing consumers of either see zero
behavior change - this only adds backend/op attribution going forward.

Removed filter.go's 9 generic increments now that the storage layer
self-reports (keeping both would double-count). Updated the 7 existing
tests that asserted on those generic increments via a backend-opaque
test double (failingSetStorage/failingDeleteStorage) - a failure from
code that isn't a real LRUStorage/L2Storage genuinely can't be
attributed, so they now assert no metric fires, only that the request
is still served and nothing panics. Added real attribution tests for the
LRUStorage/L2Storage failure paths.

LWSRE-214

Signed-off-by: Larry D Almeida <hello@larrydalmeida.com>


|
Docker image "registry-write.opensource.zalan.do/teapot/skipper:cd3d225ca769a066cd0928ca68fad21e340a863c" is not based on an approved base image. Any production deployment relying on this image will be blocked. To create a compliant Docker image of your application, you must reference an allowed Docker image as its base image in your Dockerfile. This base image must come from the Zalando Container Registry namespace |


Signed-off-by: Larry D Almeida <hello@larrydalmeida.com>
|
Docker image "registry-write.opensource.zalan.do/teapot/skipper:9e7271a6bf11679ca2709843792f0c3185e1cd9c" is not based on an approved base image. Any production deployment relying on this image will be blocked. To create a compliant Docker image of your application, you must reference an allowed Docker image as its base image in your Dockerfile. This base image must come from the Zalando Container Registry namespace |

|
👍 |


Purpose
Make cache decisions measurable without counting internal bookkeeping as user-visible cache outcomes.
Summary of changes
The important changes are:
Storage.GetSilent()for Vary-sentinel reads: suppresses outcome counters, but retains storage behavior such as warming L1 from L2.New patterns: a new storage-interface method and optional cache-specific metrics hooks. Timing measurements reuse existing conventions.
Performance considerations: additional metric updates and timing calls. Silent L2 reads still perform their real lookup and timing instrumentation.
How to Verify
Shared setup
make verifystarts or reuses Minikube, the mock origin and the stack; runs the smoke and coalescing checks; and validates supported dashboard queries. It prints a report path and exits non-zero on failure. For outage evidence, runmake chaos SKIPPER_CHECKOUT=../skipper-pr-4387 NAME=origin-stale; it includes its own timed load. Requirements: Python 3.9+, Make, Bash, Git, curl, kubectl, Minikube, Docker and Go compatible with Skipper'sgo.mod. Free ports: 8080, 8081, 6379, 4318, 9091, 9999, 9911 (8089 for endless load). Dynamic URLs:.runtime/urls.txt; stop withmake stop.Validated on #4387 (
d767f636): smoke: 6,398 requests, 0 failures; origin-stale: 155 failed revalidations across 77 routes. Smoke metric checks: 42 PASS, 2 fault-only NOT EXERCISED, 0 FAIL.Focused tests
Expected: 28 focused tests pass. Smoke exposes cache-result and L1/L2 metrics; storage-error counters require a storage fault. Valkey fault run:
make chaos SKIPPER_CHECKOUT=../skipper-pr-4387 NAME=valkey-kill; inspect storage-fault/L2-error counters and confirm requests continue. 90-second report: 10,544 requests, 0 failures.Checklist
References & Additional Context
Layer 1 of 4; followed by #4370, #4371 and #4372.
E2E Testing Results
E2E runs exercising the new cache result and storage metrics, on build 8a80d62e with local changes. Full scenario reports with embedded Grafana panel screenshots are at larry-dalmeida/skipper-cache-e2e-tests/results.
Test Scenarios Summary:
skipper_cache_result_total; 85.4% over the final minuteMetrics Panels Validating PR Changes:
Cache Hit Ratio — hit share computed from the new
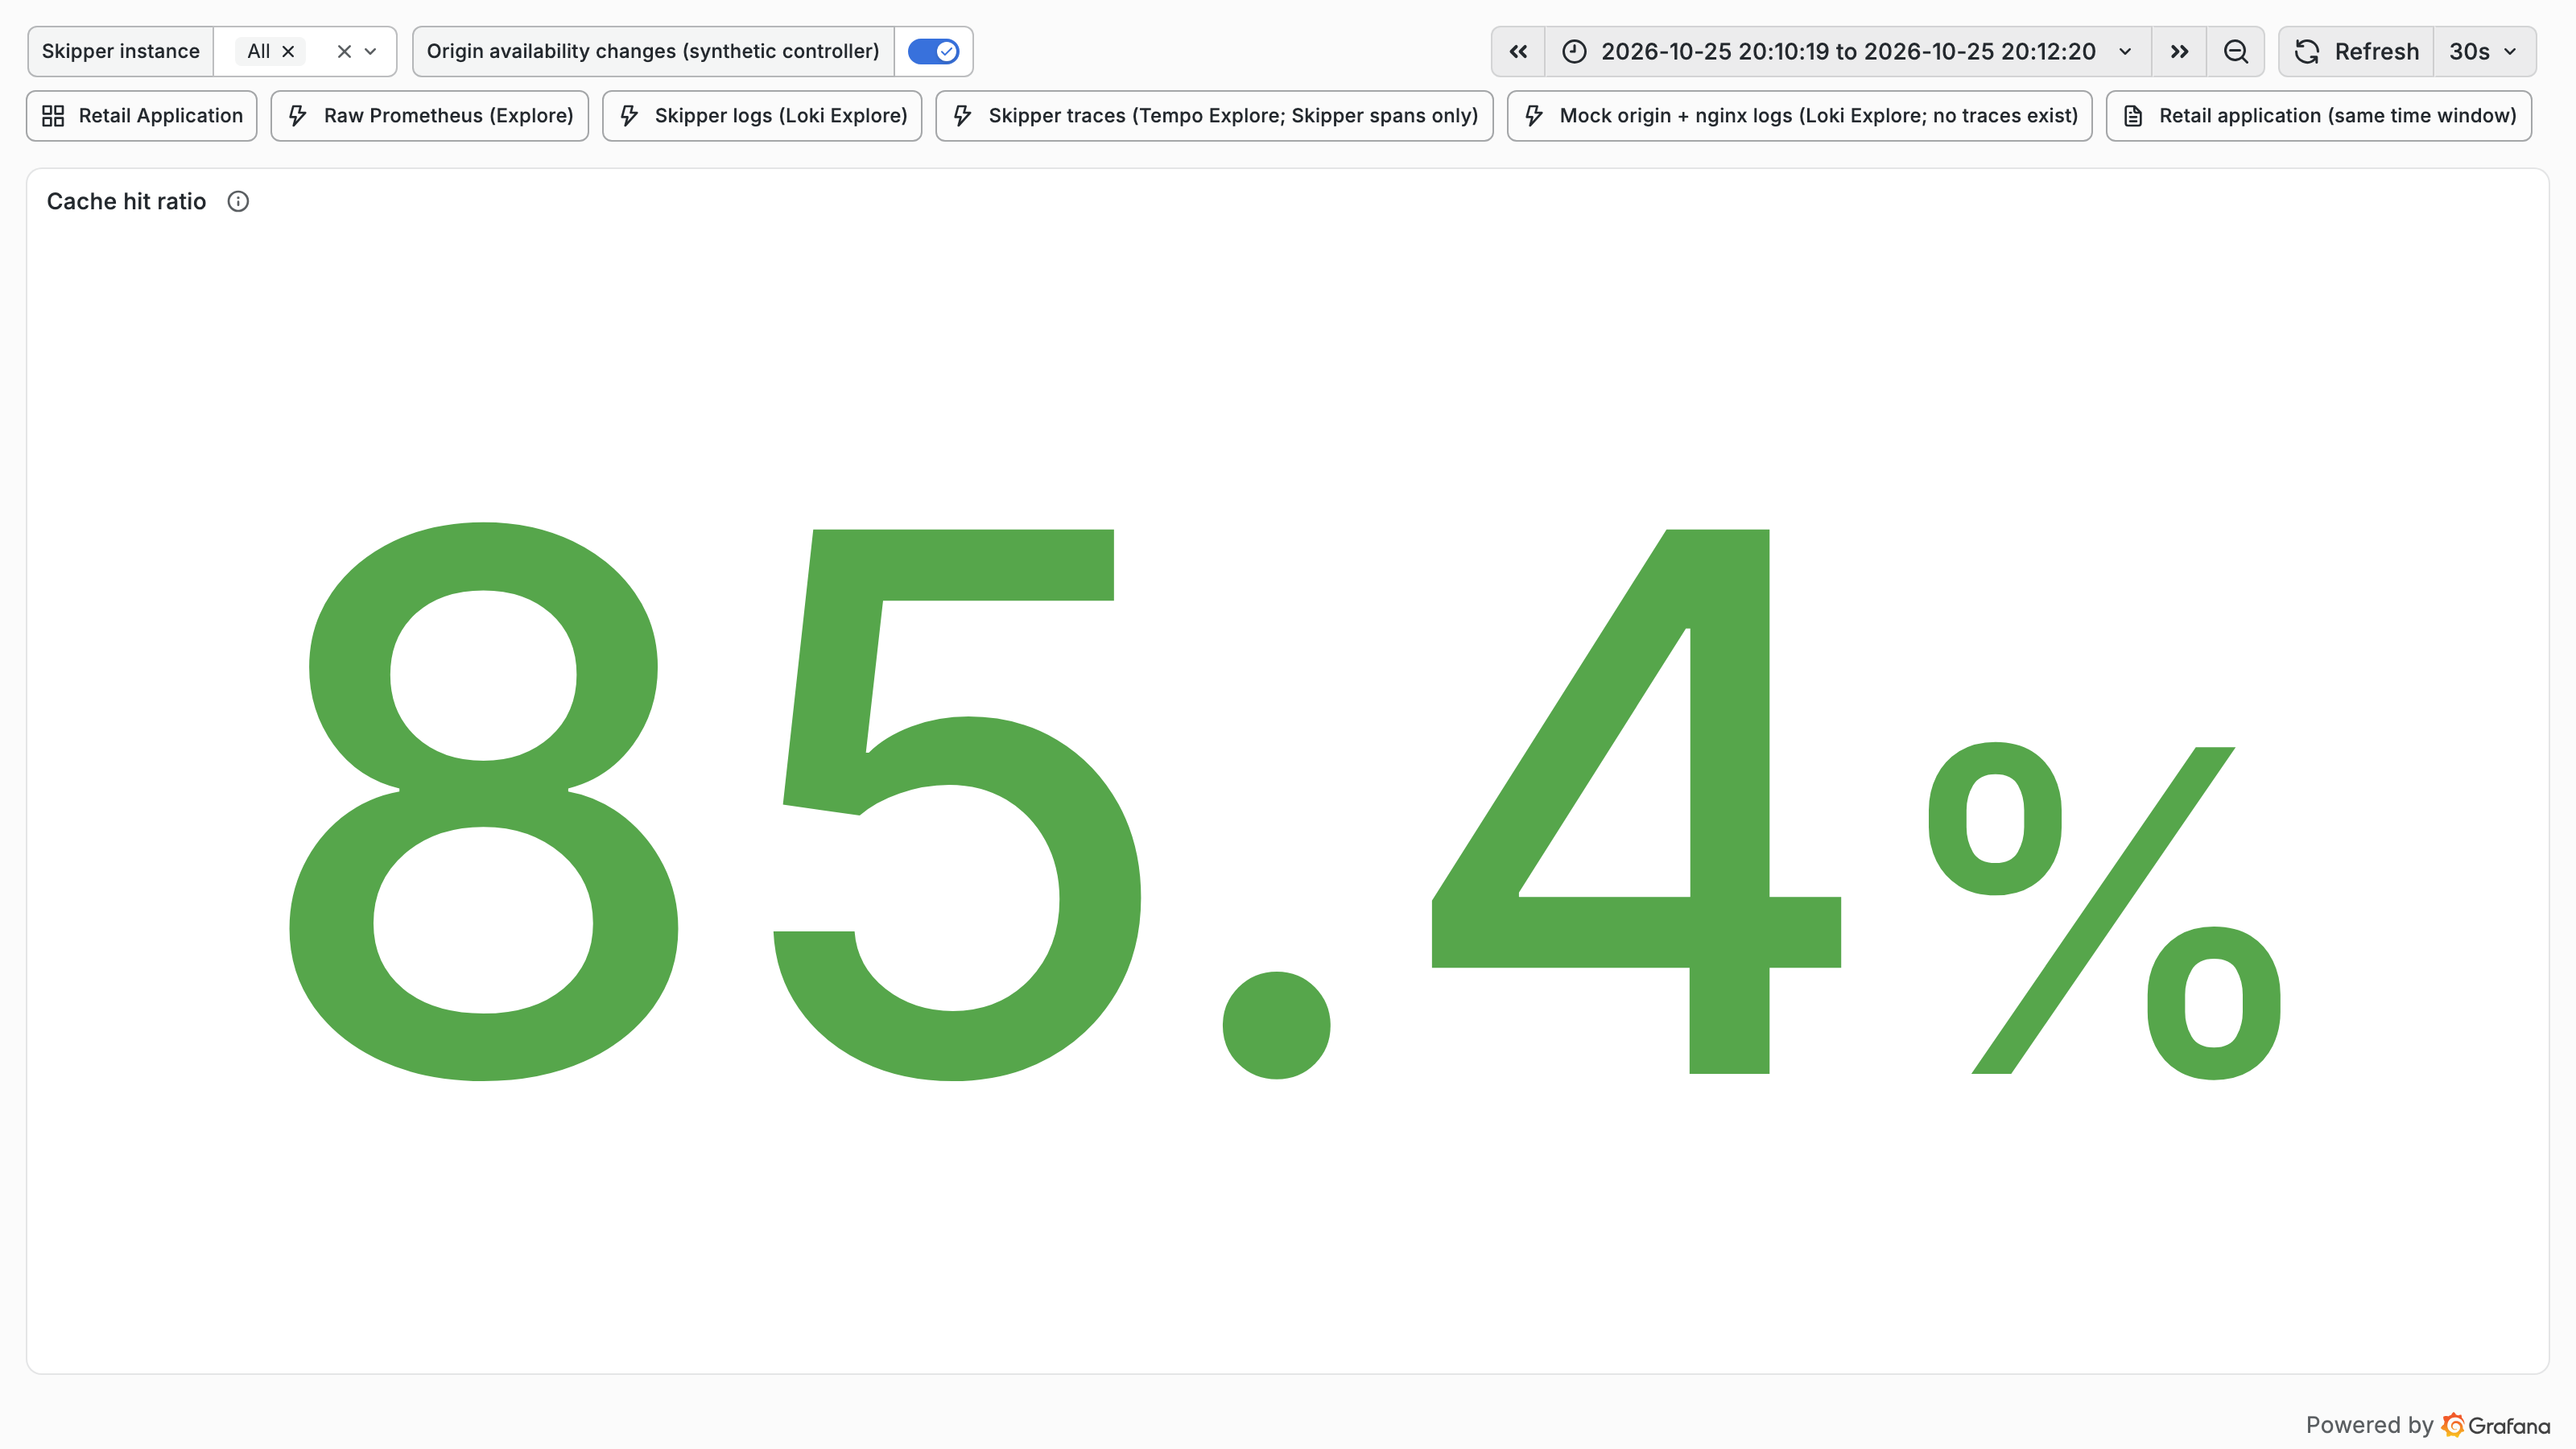
skipper_cache_result_total{result,code_class}counter (smoke, 85.4% over the final minute)Cache Result by Status Class —
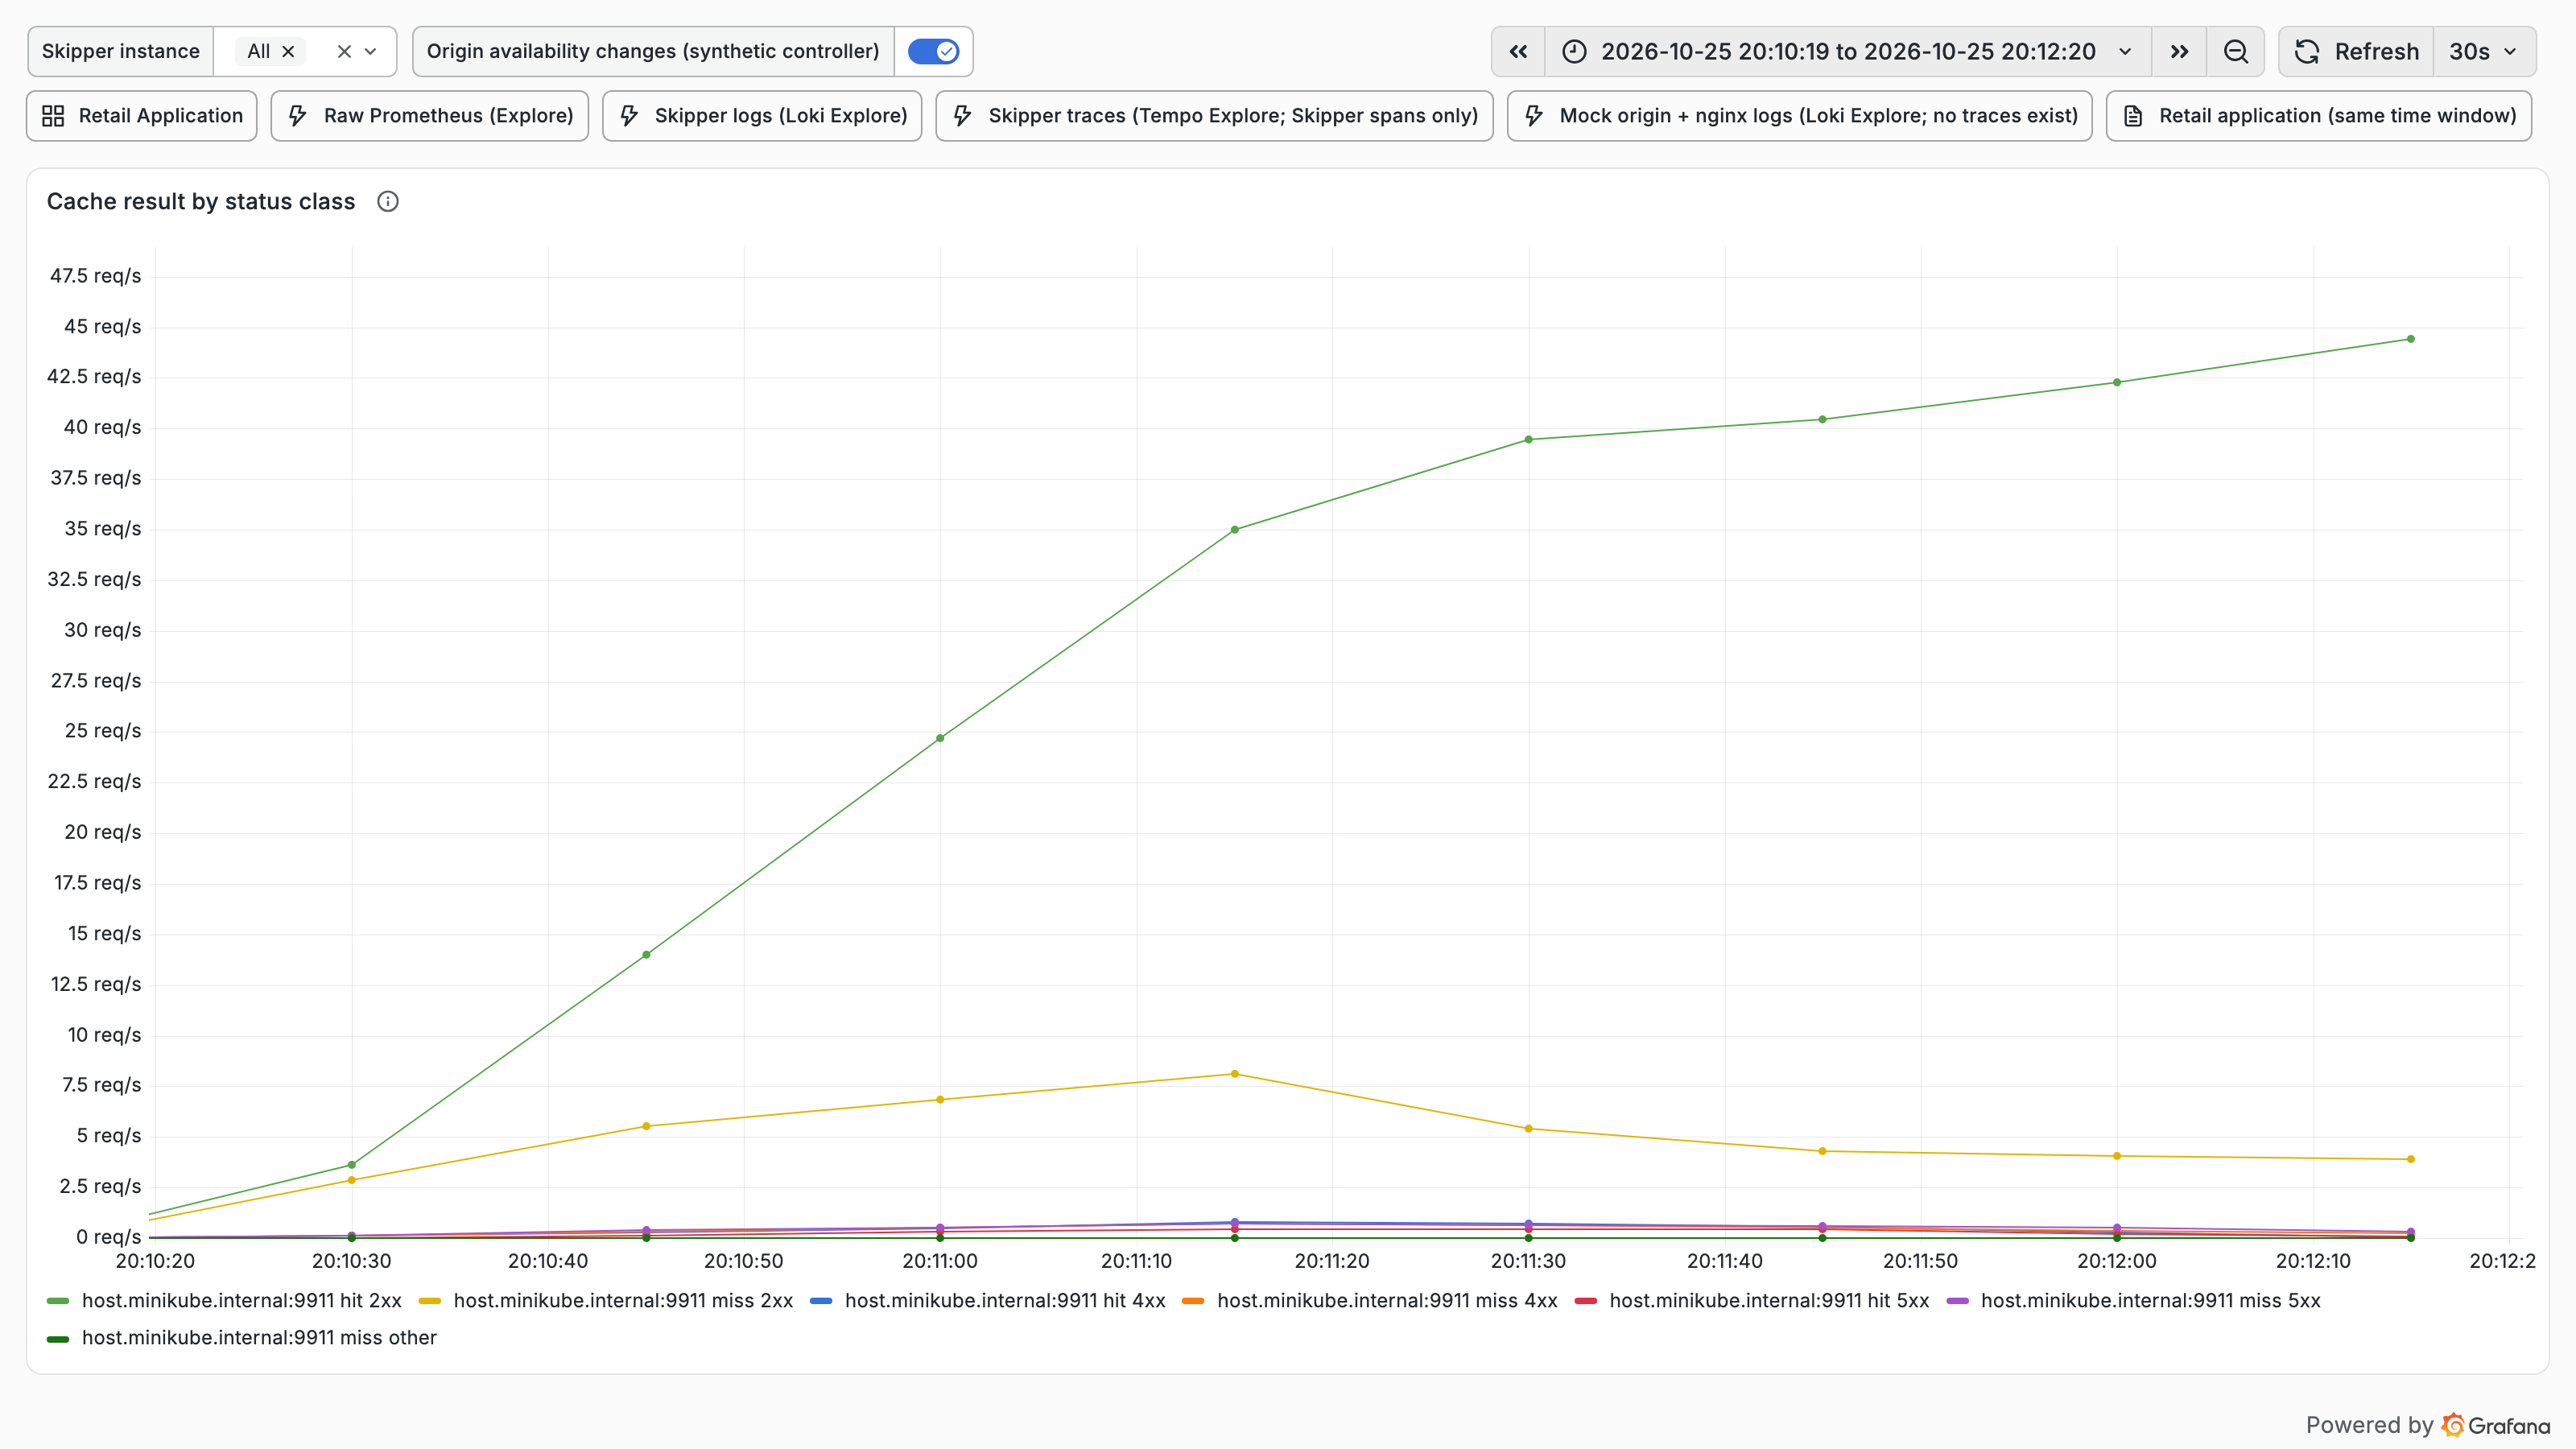
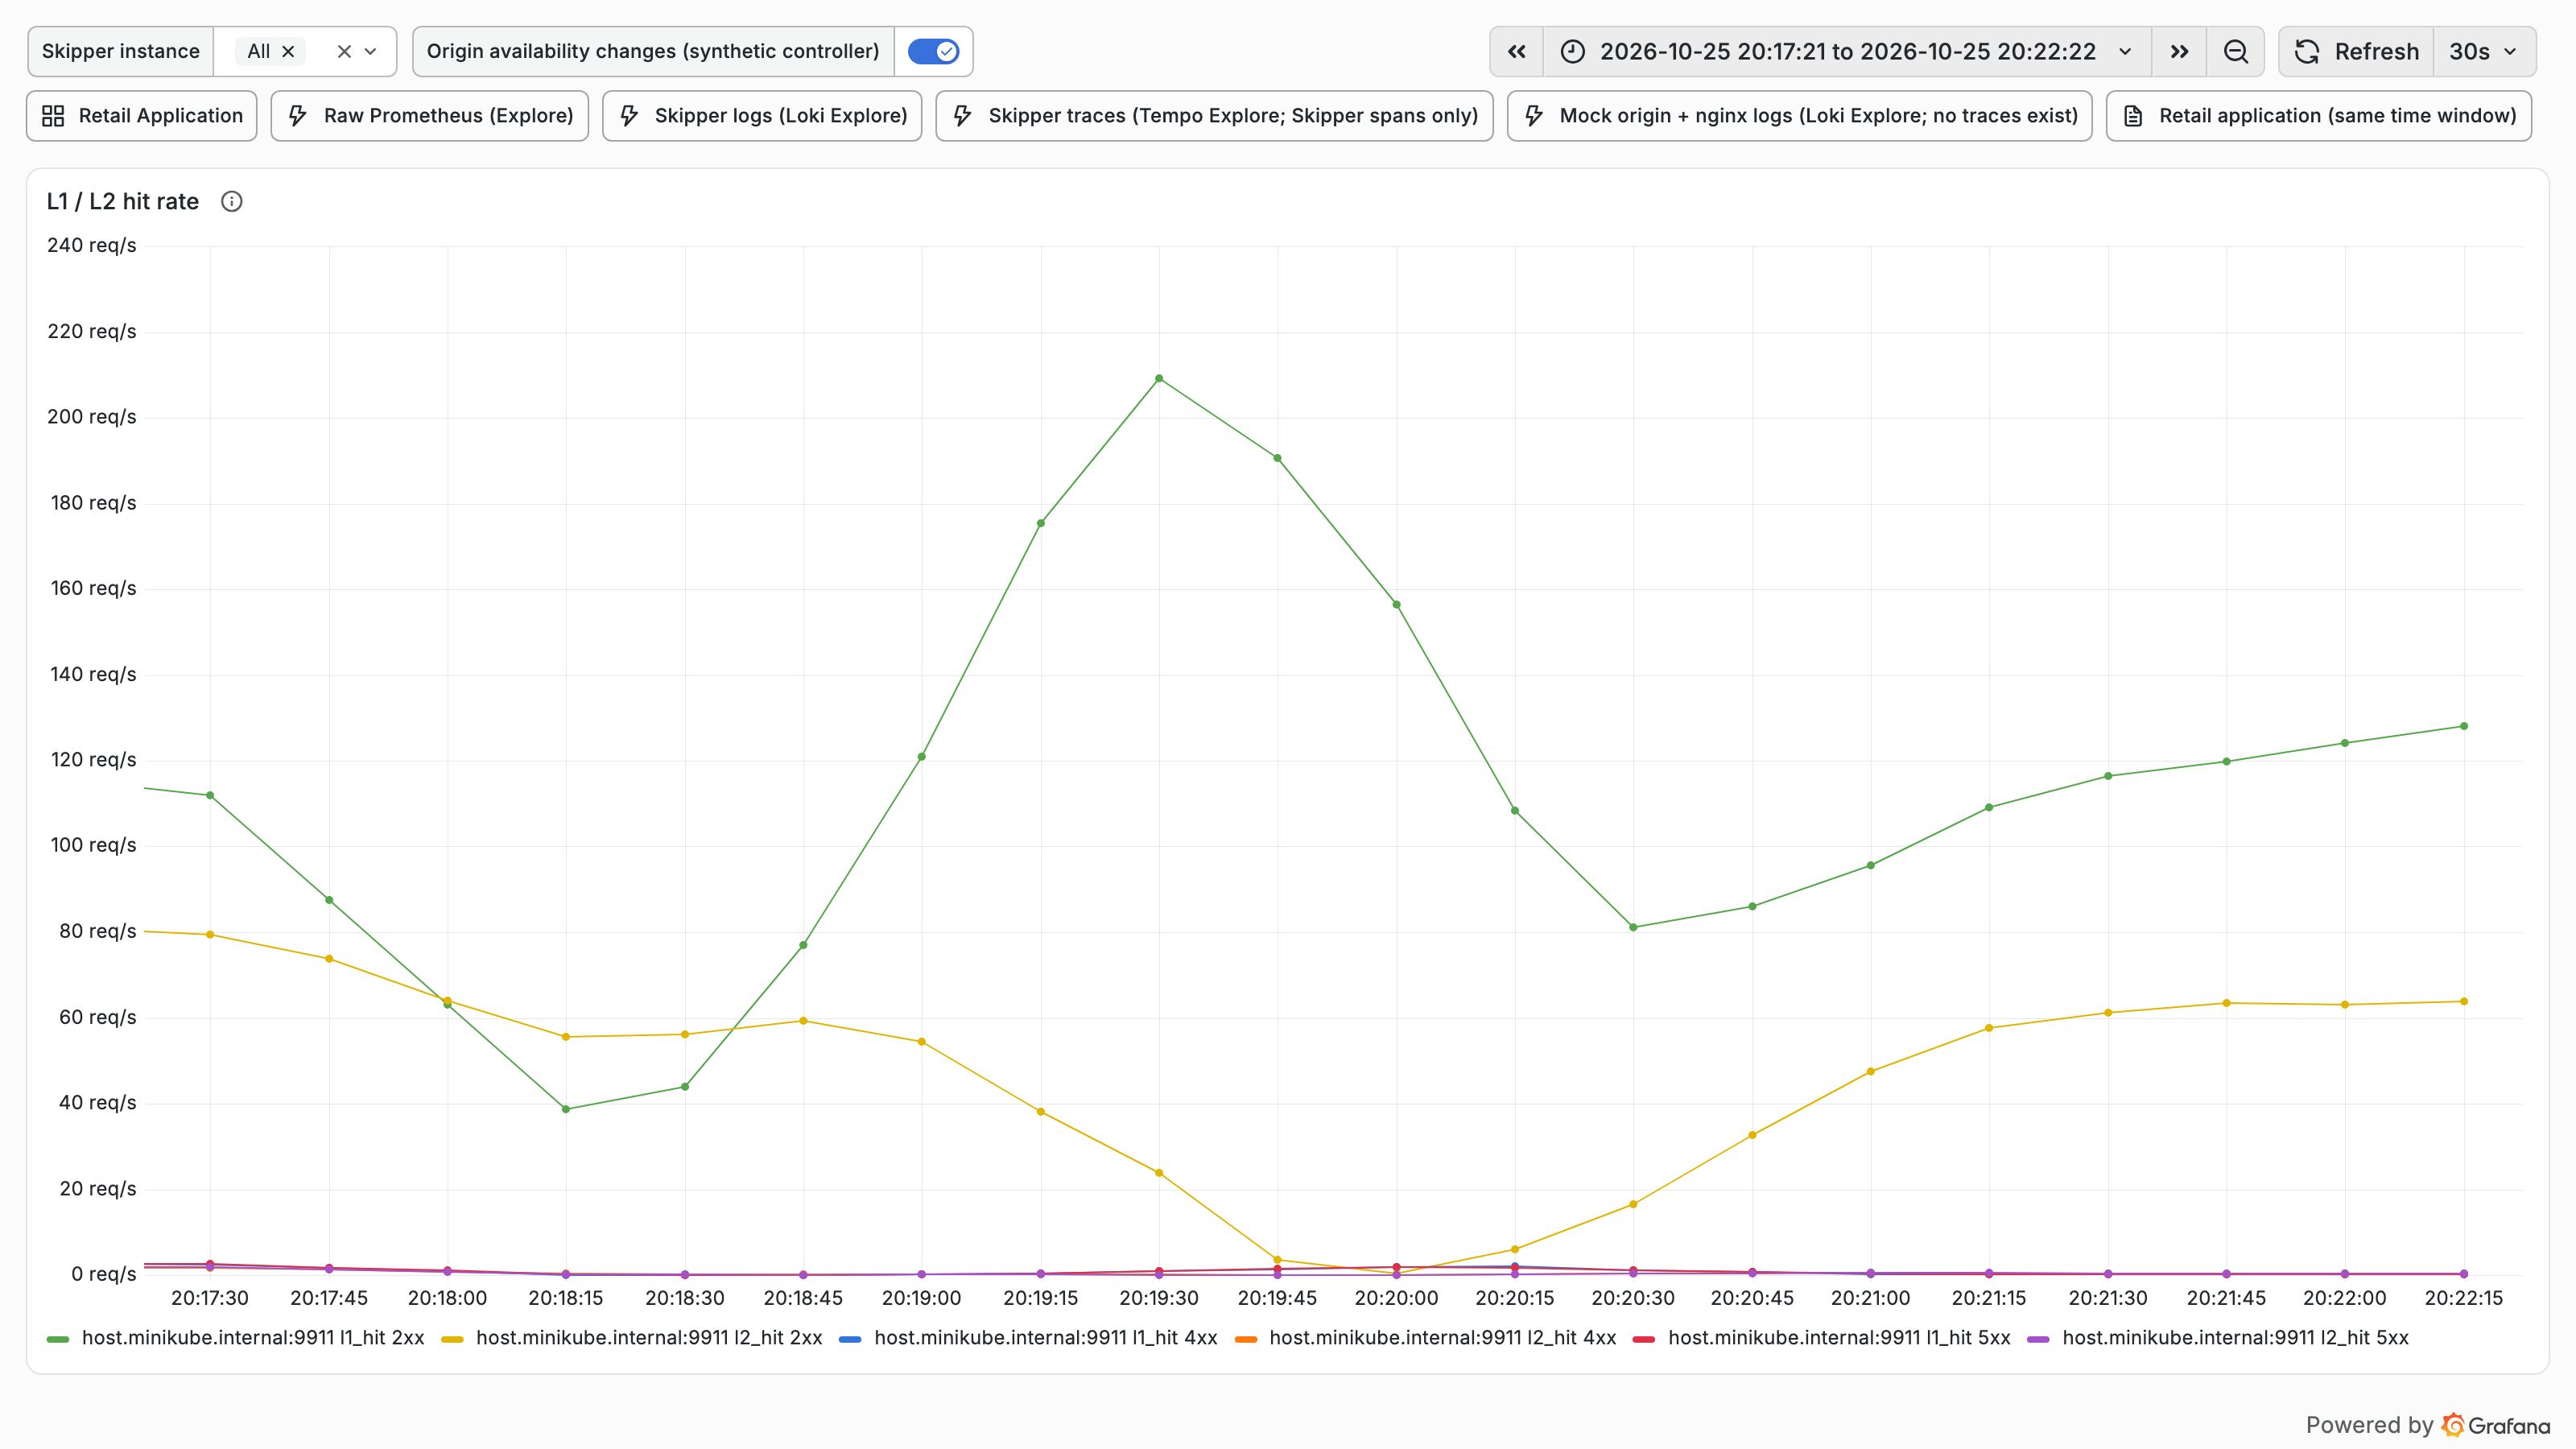
skipper_cache_result_totalsplit byresultandcode_class(smoke): hit 2xx up to ~44 req/s, miss 2xx at ~4–8 req/s, plus small hit/miss 4xx/5xx seriesL1/L2 Hit Rate — separate L1 (memory) and L2 (Valkey) hit series (valkey-kill): L2 hits fall to ~0 while Valkey is down, L1 carries the load (peak ~210 req/s), then L2 recovers
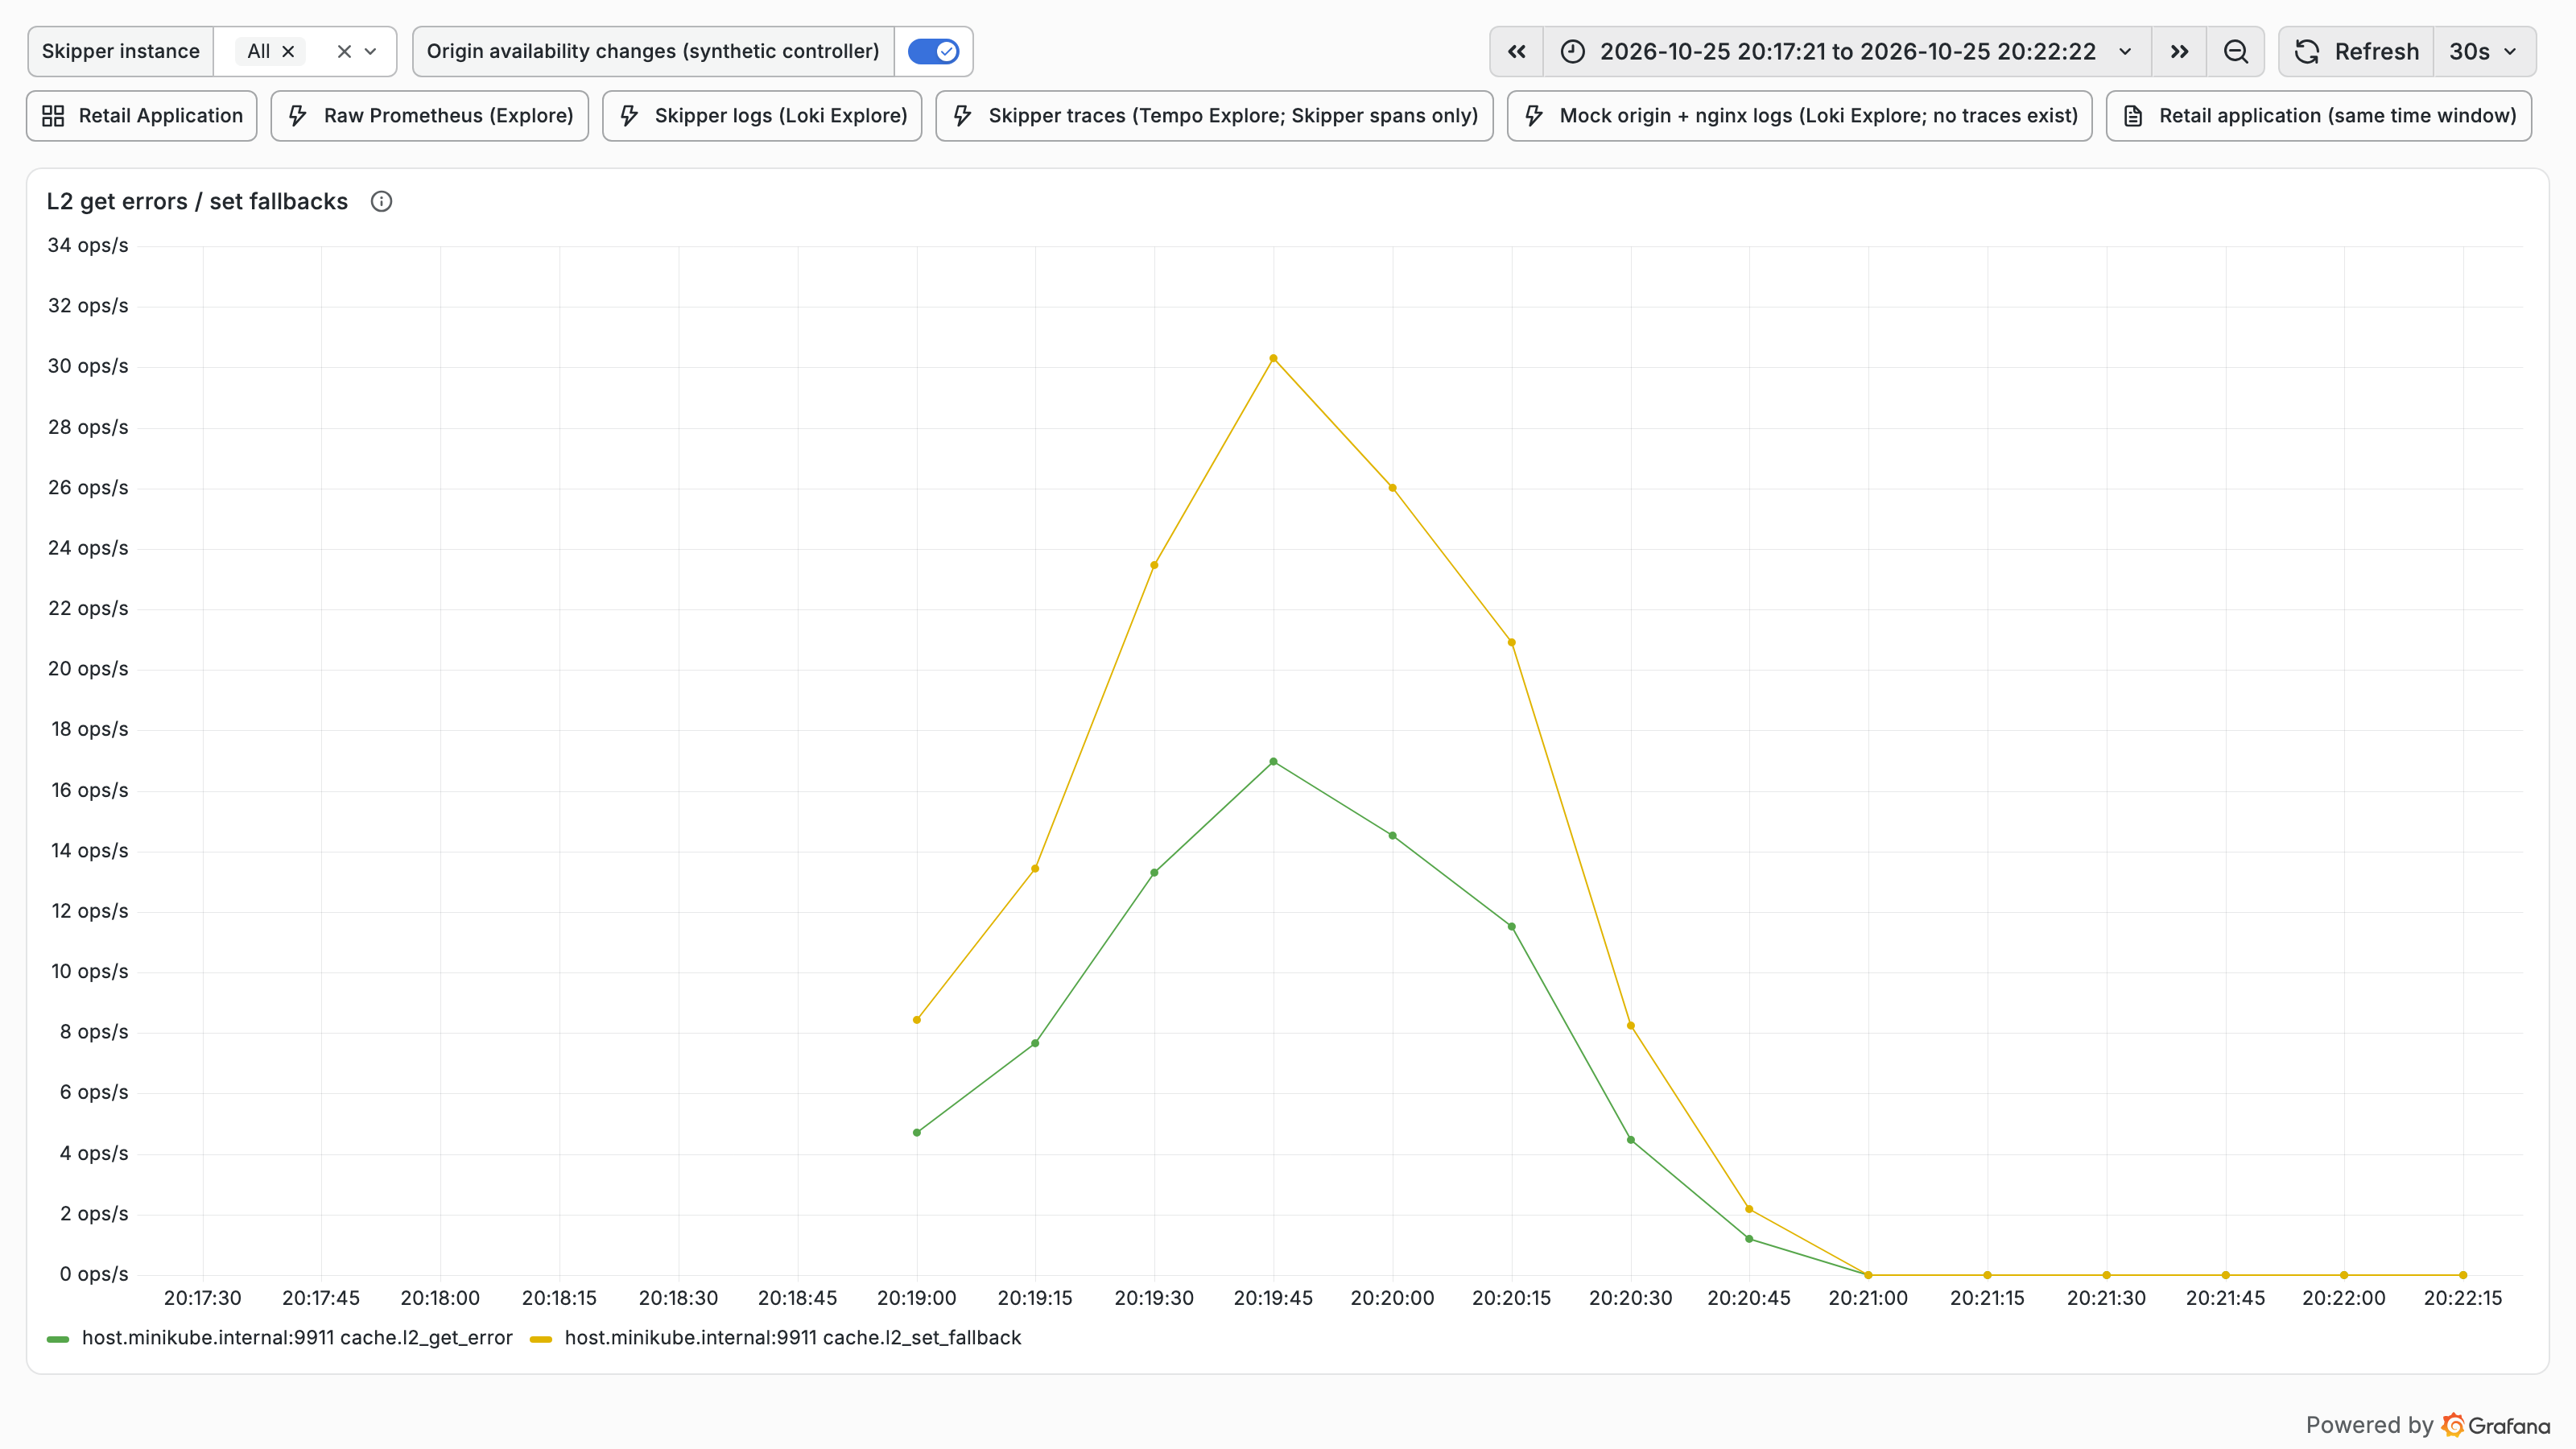
L2 Get Errors / Set Fallbacks — L2 errors while Valkey is down (valkey-kill): 1,095 get errors (peak ~17 ops/s) and 1,961 set fallbacks (peak ~30 ops/s)
L1/L2 Storage Faults —
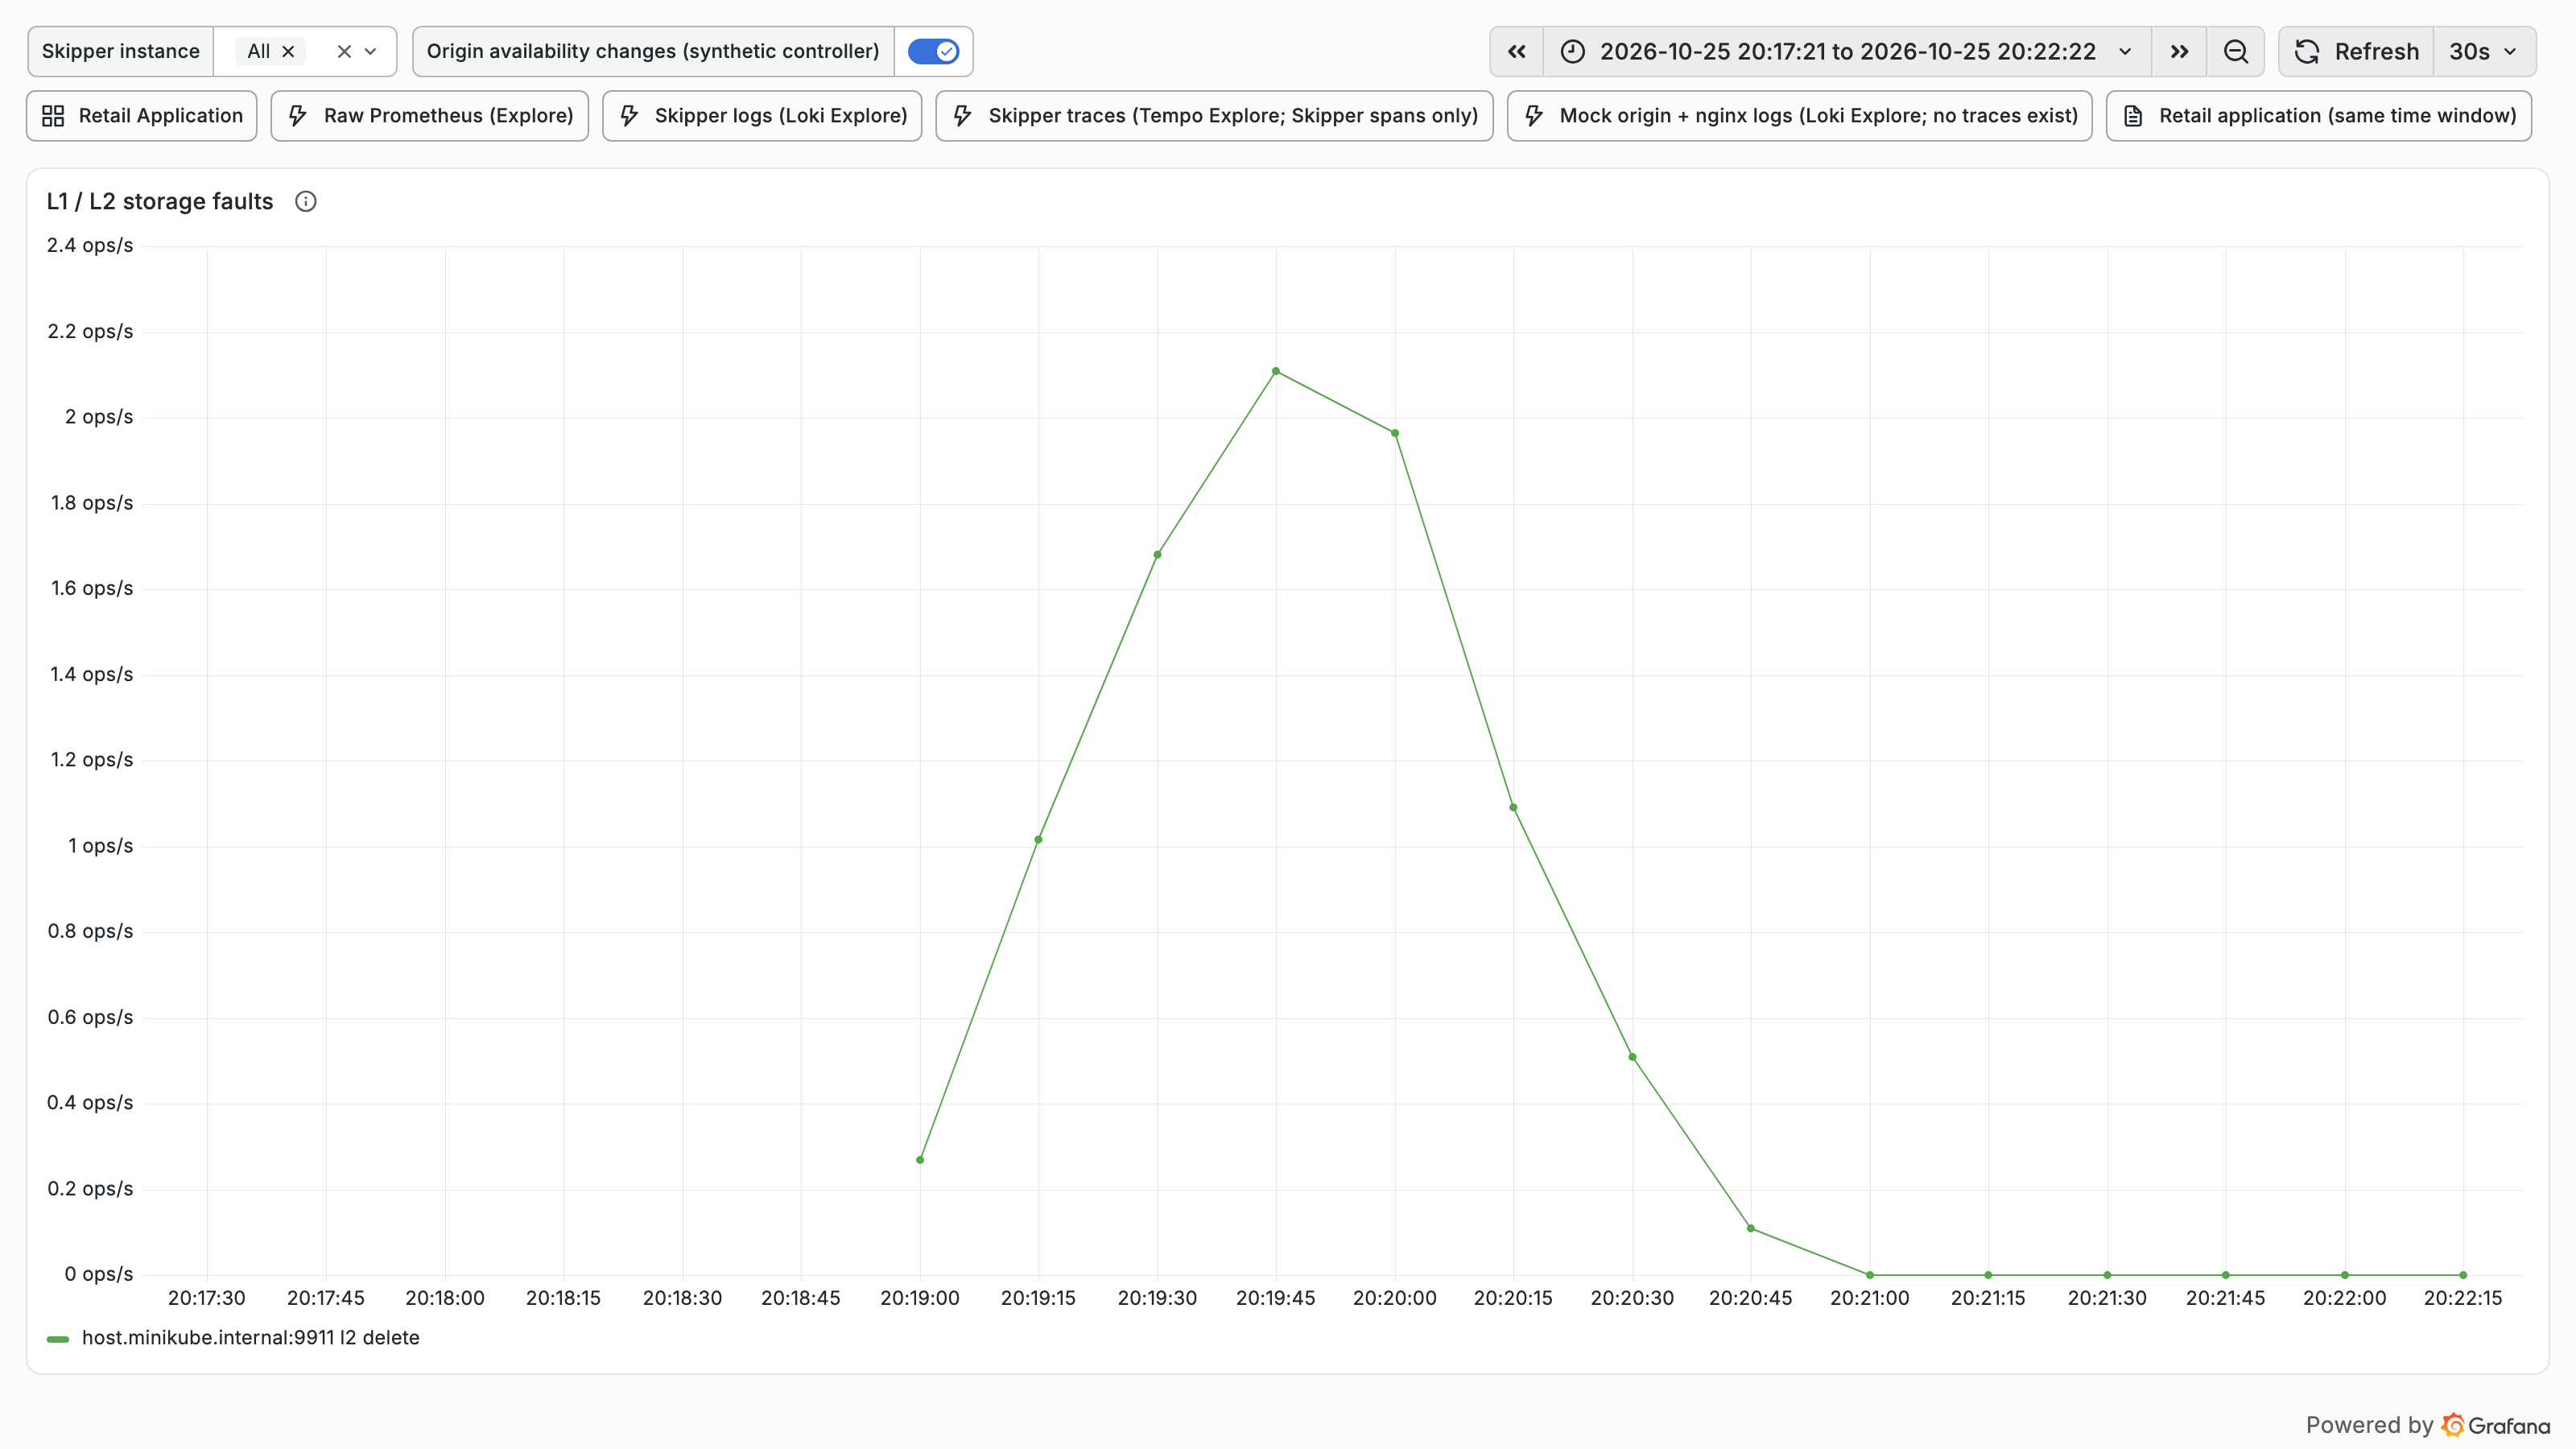
skipper_cache_storage_error_total(valkey-kill): 131 faults, allbackend=l2 op=delete, peaking at ~2.1 ops/s while Valkey was downOrigin Offload — share of requests served without an origin fetch (smoke), rising from ~55% to ~82% as the cache warms
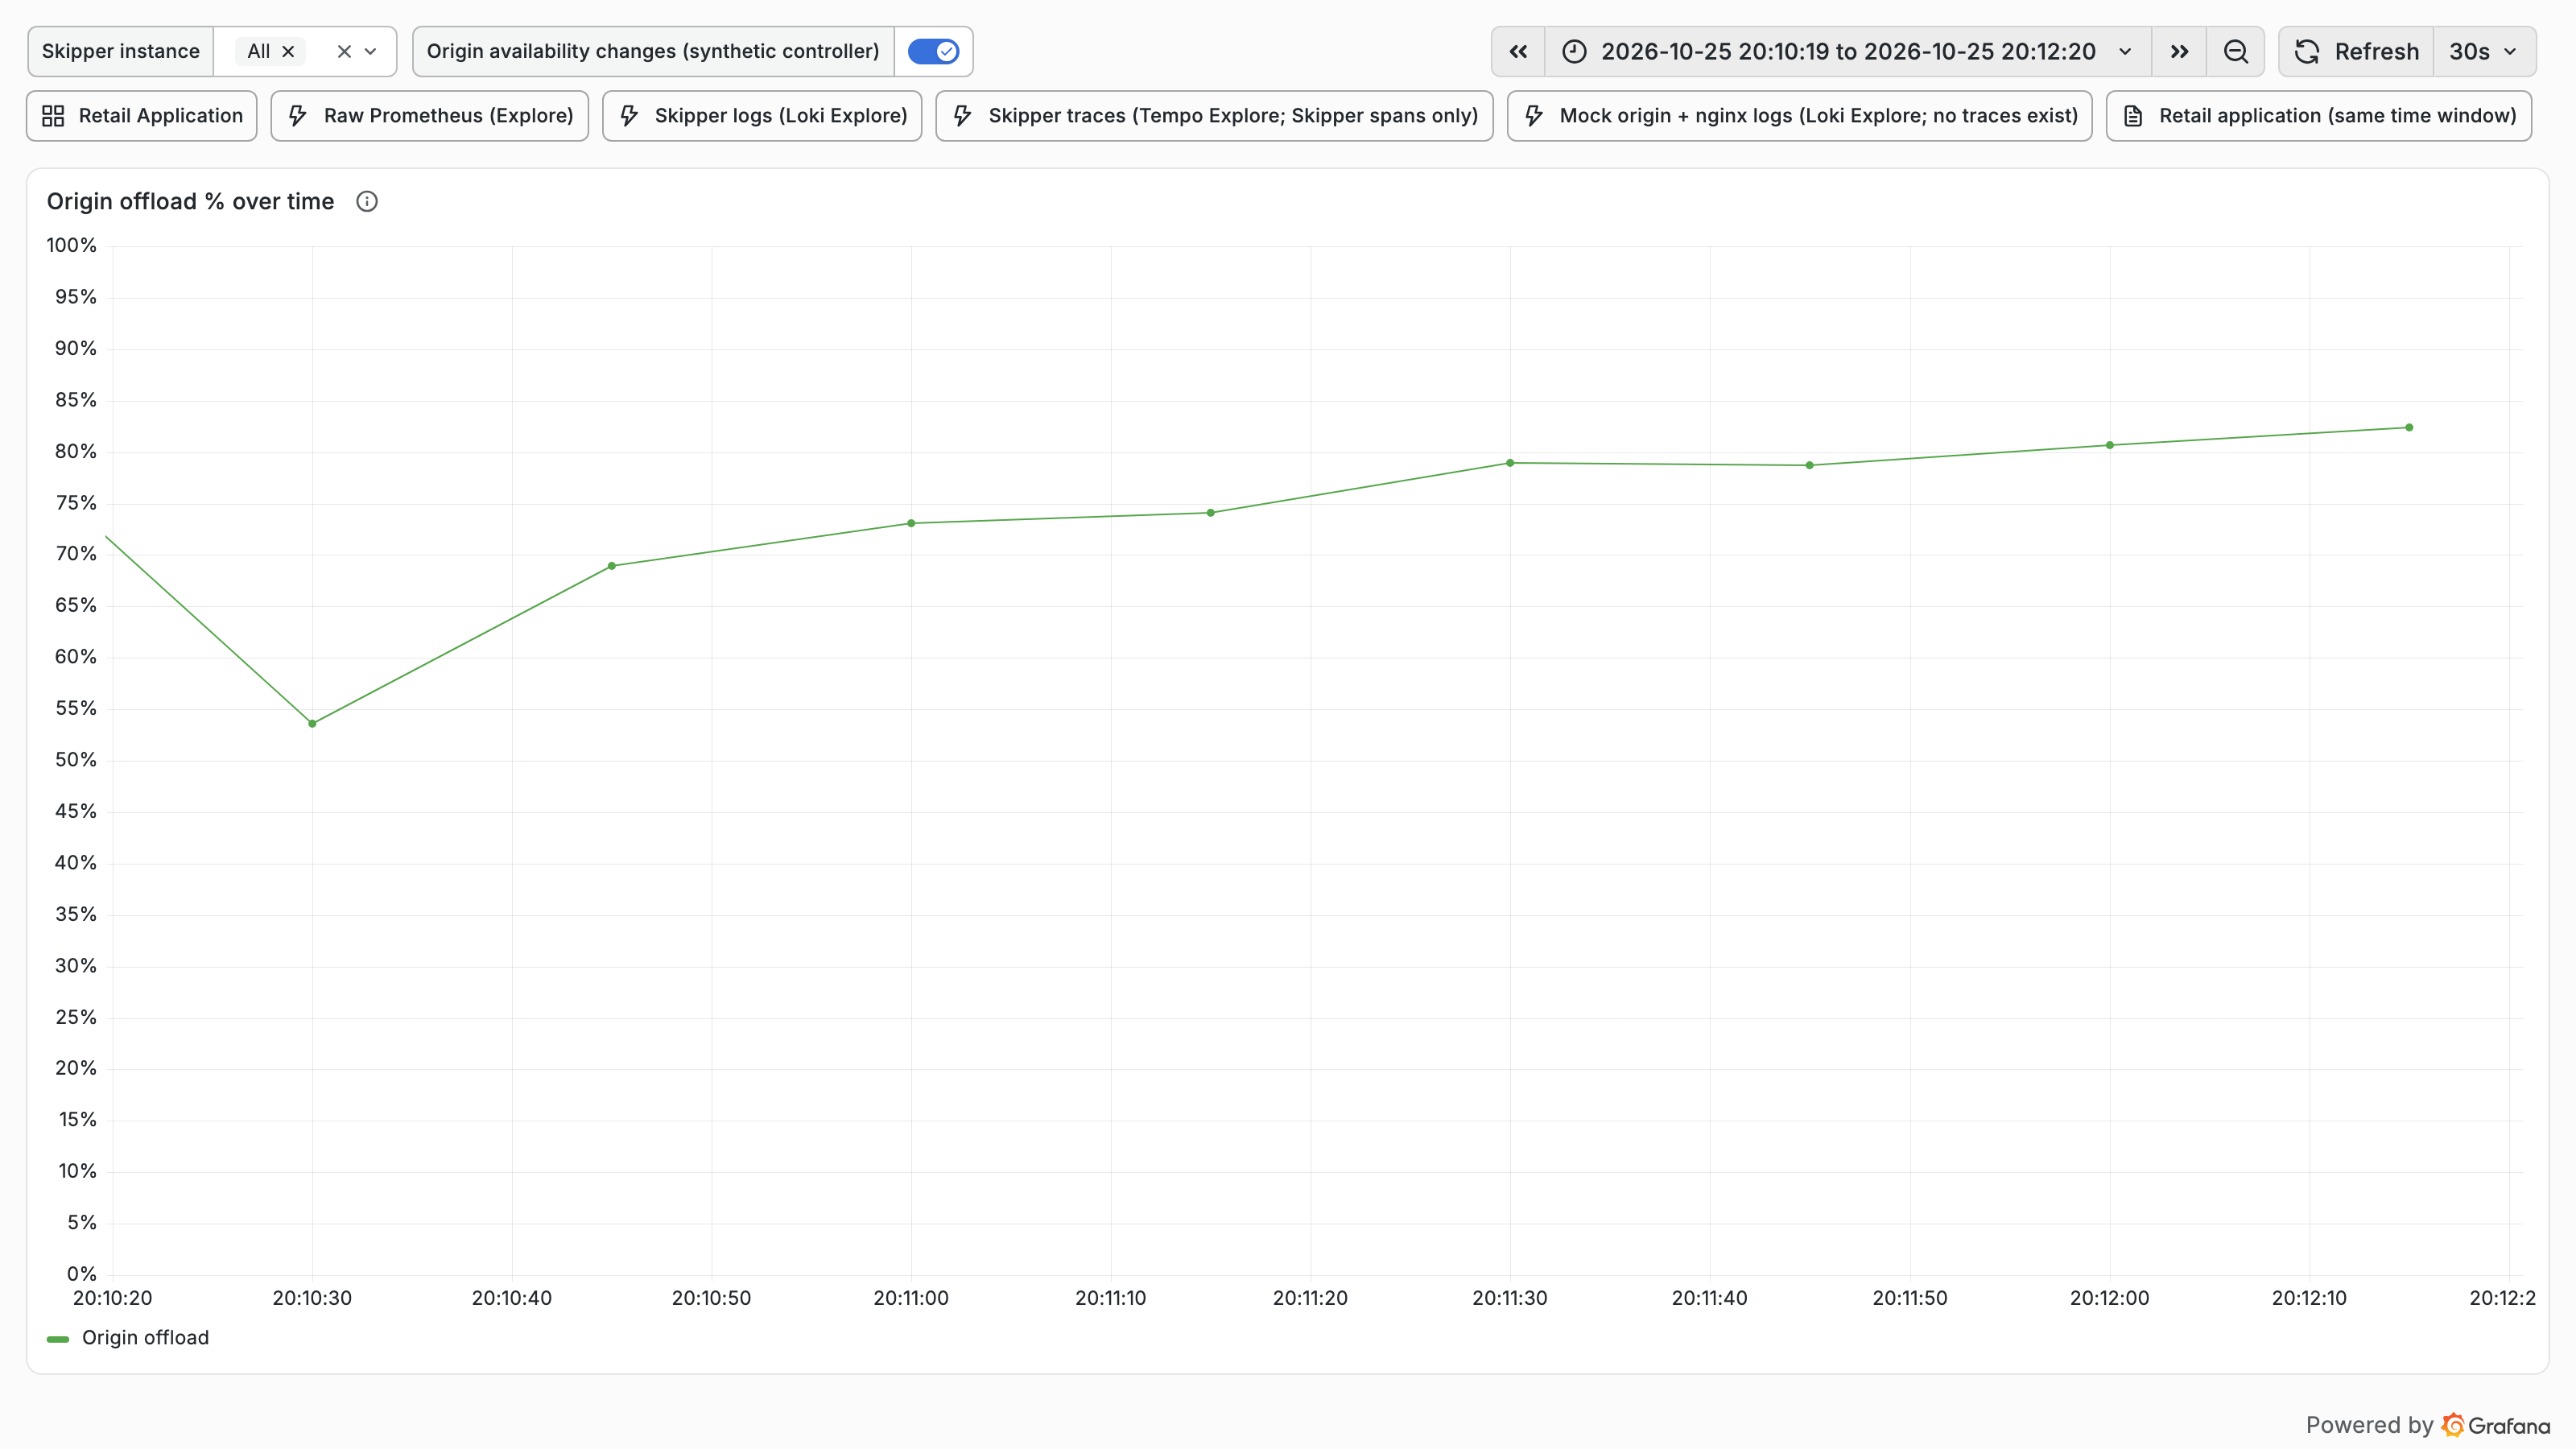
Not shown by these runs: that
Storage.GetSilent()does not inflate outcomes on sentinel reads, since no panel isolates those reads; and thecoalesce_error/coalesce_bypass_errorresults, which never occurred.