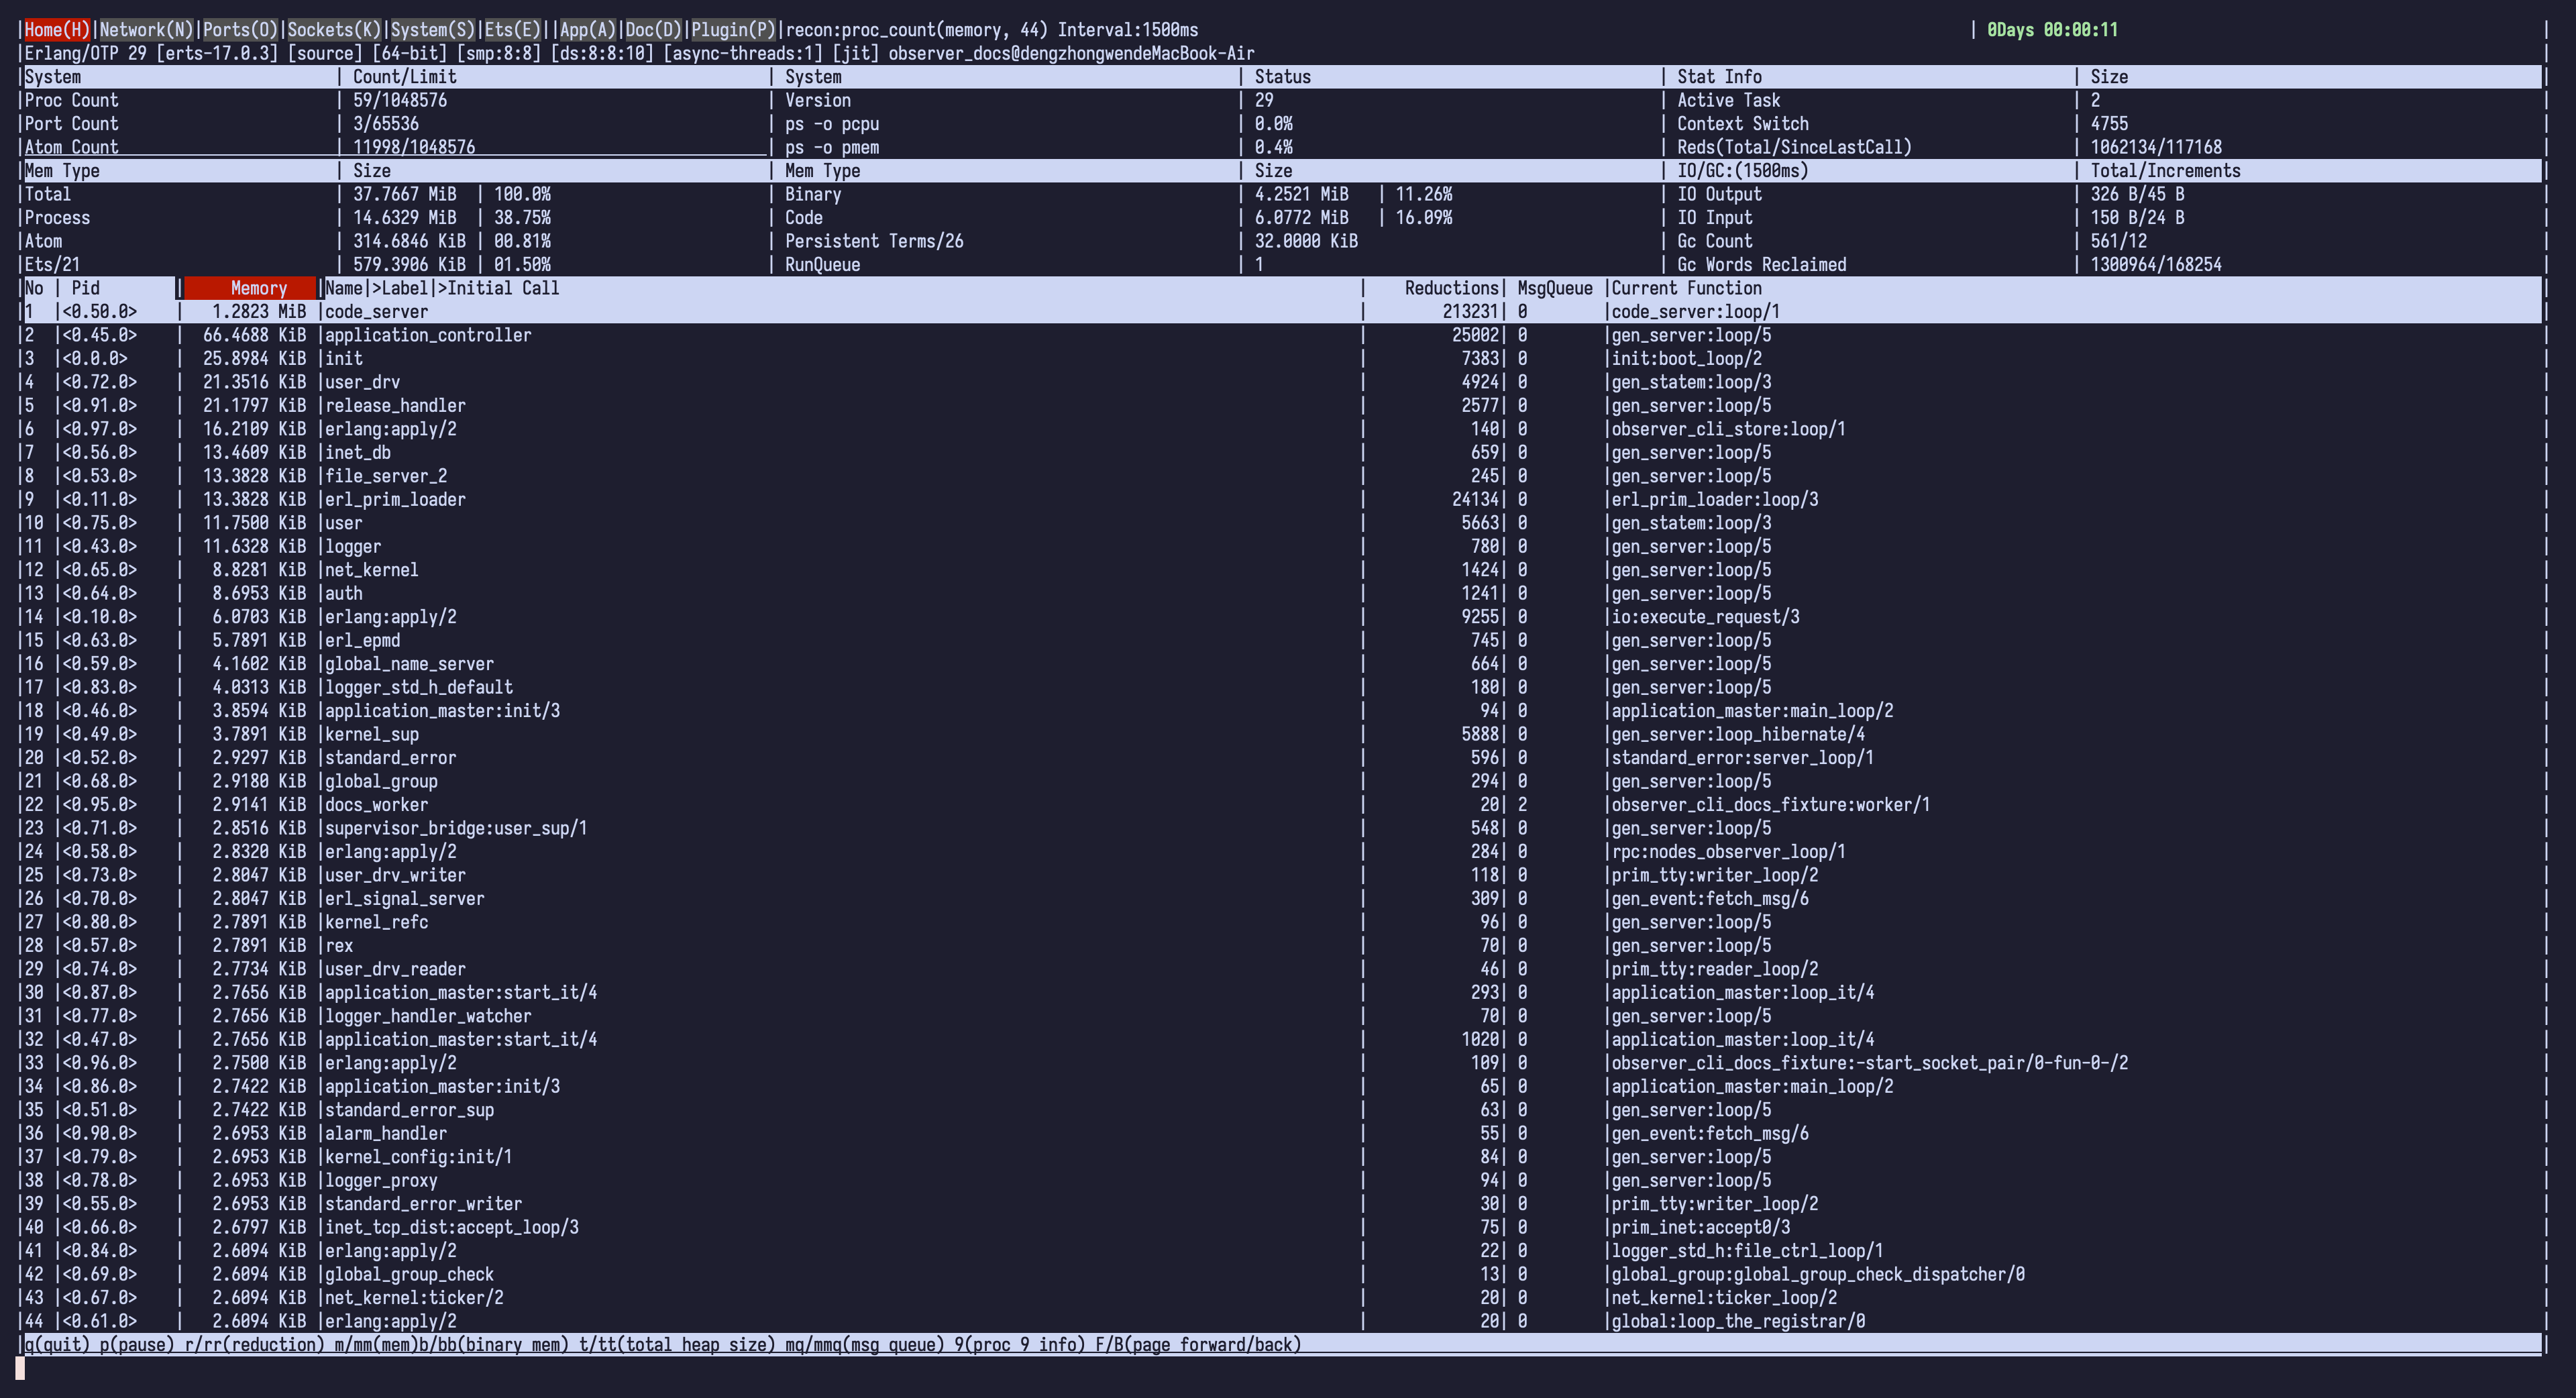
The terminal UI shows a live, line-oriented view of one BEAM node. Type a shortcut and press Enter; an empty line means Enter by itself.
Build the escript, then use the explicit tui command. This example uses the
cookie supplied through a protected environment source:
rebar3 escriptize
./_build/default/bin/observer_cli tui --node app@host --cookie-env OBSERVER_CLI_COOKIE
Press D for the built-in shortcut page and q to quit. The old bare
observer_cli NODE [COOKIE REFRESH_MS] form is not supported.
From the generated escript:
observer_cli tui [TARGET OPTIONS] [--interval DURATION] [--load-code]
--interval defaults to 1500ms and accepts 1000ms..120s. Use the same
atomic target options or shell environment as the command CLI. Positional cookie
values are not supported. A hidden controller is stopped after the UI exits.
A matching installed TUI bundle is used without code injection. When code
loading is needed, explicitly pass --load-code; it requires the same
controller/target OTP major. Without consent, a missing or incompatible bundle
is reported instead of being loaded. This changes the escript entrypoint, not
TUI pages, plugins, or their explicit sensitive process subviews.
From an Erlang shell:
observer_cli:start().
observer_cli:start(2000).
observer_cli:start(RemoteNode).
observer_cli:start(RemoteNode, Cookie).
observer_cli:start(RemoteNode, [{cookie, Cookie}, {interval, 2000}]).
The integer form sets the refresh interval for most local pages; App keeps its default. The options form is for a remote node.
| Page | Key | Contents |
|---|---|---|
| Home | H |
VM summary, memory and GC deltas, optional scheduler utilization, and ranked processes |
| Network | N |
VM I/O totals and legacy inet Port counters |
| Ports | O |
Non-inet Erlang Port metadata and counters |
| Sockets | K |
OTP socket registry summary, counters, and socket details |
| System | S |
System/architecture facts, allocators, cache rates, and distribution state |
| ETS | E |
ETS table metadata |
| Mnesia | M |
Local Mnesia table metadata; the menu entry appears only while the schema table exists |
| App | A |
Process resources grouped by application |
| Doc | D |
Built-in shortcut summary |
| Plugin | P |
Configured plugin sheets |
flowchart TB
    NAV["Main pages · global shortcuts<br/>H Home · N Network · O Ports · K Sockets · S System<br/>E ETS · M Mnesia · A App · D Doc · P Plugins"]

    PICK_PROCESS["Choose a process<br/>Home ranking · plugin PID row"]
    PICK_PORT["Choose a port<br/>Network row · Ports row"]
    PICK_SOCKET["Choose a socket<br/>Sockets row"]

    PROCESS["Process detail<br/>Return: H · B to source page"]
    PORT["Port detail<br/>Return: N · O · H"]
    SOCKET["Socket detail<br/>Return: K · H"]

    NAV --> PICK_PROCESS --> PROCESS
    NAV --> PICK_PORT --> PORT
    NAV --> PICK_SOCKET --> SOCKET
The diagram separates two navigation mechanisms: global shortcuts among peer main pages, then context-specific row drill-down. Pages without a row-detail transition appear only in the global shortcut set. The tables below are authoritative for all shortcuts and behavior.
The Home, Network, Ports, Sockets, ETS, Mnesia, App, and Plugin lists use
terminal height to choose the visible row count. If terminal geometry is
unavailable, default_row_size defaults to 30 rows.
The field tables below describe the labels rendered by the current TUI. The
Source column identifies the source API and key where the value is fixed.
Relevant API references are the Erlang/OTP erlang,
persistent_term,
inet,
socket,
ets, and
mnesia modules, plus
recon and
recon_alloc.
- Values passed through the byte formatter use
B,KiB,MiB, orGiB. Byte-valued exceptions rendered as raw integers, plus raw counts and words, are identified below. - A total is cumulative for the VM or resource. An increment or delta is the current sample minus the preceding sample; it is not a per-second rate.
- A Recon count is a point-in-time ranking. A Recon window is the difference between two samples separated by the configured interval.
deadmeans that a resource disappeared.unavailablemeans a required capability is missing.undefinedmarks an unsupported or absent property.-can represent an empty state or an endpoint that is not connected. Socket counters and options can vary with the OTP release, operating system, domain, type, and protocol.
Most built-in main and list pages use the shared input parser below. A page ignores actions it does not implement; detail and plugin views document their own inputs later in this reference.
| Input | Action |
|---|---|
H, N, O, K, S, E, M, A, D, P |
Switch main page |
q or Q |
Quit the TUI |
F, pd, or PD |
Next page |
B, pu, or PU |
Previous page; page 1 is the lower bound |
Integer at least 1000 |
Set the active page's refresh interval in milliseconds |
Positive integer below 1000 |
Select that row on pages with row drill-down; otherwise ignored |
| Enter | Open the remembered row on Home and Network; otherwise page-specific |
Pages that accept interval changes retain their own value while you navigate.
The Home ranking has two collection modes:
- count mode calls
recon:proc_count/2once per refresh; - window mode calls
recon:proc_window/3for the configured interval.
The first redraw after entering a window mode still uses proc_count; later
redraws use proc_window.
| Input | Ranking |
|---|---|
r / rr |
Reductions, count/window |
m / mm |
Memory, count/window |
b / bb |
Referenced binary memory, count/window |
t / tt |
Total heap size, count/window |
mq / mmq |
Message queue length, count/window |
p |
Pause or resume Home redraw |
` |
Enable or disable scheduler wall-time utilization rows and their Normal/Dirty CPU summary together |
| Row number | Open that ranked process |
| Enter | Open the remembered ranked process |
Full PID, for example <0.43.0> |
Open a local process even if it is not ranked |
<431 or >431 |
Open <0.431.0> |
Scheduler usage remains disabled by default (unless the existing configuration
explicitly enables it). The existing Home rendering worker holds one
scheduler_wall_time measurement registration while enabled. Closing the view,
disabling usage, or terminating that worker releases its registration; other
tools' registrations remain unchanged. No independent summary registration,
worker, or background sampler is created.
| Field | Meaning and unit | Sampling | Source |
|---|---|---|---|
| Header | ERTS system version, node name, and VM uptime | Version/name are stable; uptime is current | system_info(system_version), node(), statistics(wall_clock) |
Proc Count |
Existing processes / process limit; red above 85% | Current | system_info(process_count), system_info(process_limit) |
Port Count |
Existing Ports / Port limit; red above 85% | Current | system_info(port_count), system_info(port_limit) |
Atom Count |
Existing atoms / atom limit; red above 85% | Current | system_info(atom_count), system_info(atom_limit) |
Ets Limit |
ETS table limit, shown instead of Atom Count when atom_limit is unsupported |
Stable | system_info(ets_limit) |
Version |
OTP release | Stable | system_info(otp_release) |
BEAM CPU |
OS-process user + system CPU time consumed over the actual window; 100% means one logical CPU, and values can exceed 100% | Window | Linux /proc/self/stat; macOS ps time |
BEAM RSS |
Current resident memory, plus its signed change since the preceding valid sample (not bytes/second) | Current / window change | Linux /proc/self/stat; macOS ps rss |
Active Task |
Active processes and Ports ready or running on normal and dirty-CPU schedulers; dirty IO is excluded | Current | statistics(total_active_tasks) |
Context Switch |
VM context-switch count | Total | statistics(context_switches) |
Reds(Total/SinceLastCall) |
Total reductions / reductions since this API was last called | Total / API-call increment | statistics(reductions) |
CPU window reports the actual monotonic-time interval for OS CPU sampling,
independent of the process ranking's Sample interval. Home shows it in the
sampling header when it fits without losing process rows; otherwise its existing
summary table header carries the window. System also shows the interval in its
statistics. First samples show warming up; unavailable counters show
unavailable (n/a in the compact window header), never a fabricated zero.
Pausing and resuming, changing interval, or opening another view starts a new
baseline. Failed reads, counter resets, or identity changes invalidate the
corresponding baseline; CPU and RSS availability are independent.
Counters are read on the target BEAM node, not the controller. Linux caches the
actual clock-tick rate and page size at view initialization; its inexpensive RSS
counter is approximate. macOS reads cumulative user + system time, RSS and VSZ
in one controlled ps invocation. External commands have a 4 KiB output cap and
a min(500ms, refresh interval) collection deadline; failed or timed-out
commands are discarded and terminated (with bounded cleanup). No OS sampler
runs while Home is paused, and no background polling service is created.
In narrow System value cells, RSS uses a compact representation such as
182M +3.0M; K, M, G, and T mean KiB, MiB, GiB, and TiB respectively.
The current resident size and its signed change remain visible together.
RSS is the OS view of resident physical memory. It is not the same as
erlang:memory()'s VM-accounted allocations, and their difference alone does
not establish a leak. Released VM memory need not immediately reduce RSS.
Host physical-memory percentages are no longer shown as node memory usage;
they would not describe a container's memory budget.
To reproduce CPU transitions, resident-memory allocation and two-node identity checks after compiling, run:
scripts/runtime-metrics-smoke.escript _build/default/lib/observer_cli/ebinThe smoke launches only its own temporary worker processes and peer node. It uses four normal schedulers, does not enable scheduler wall-time measurement, and does not require RSS to fall immediately after releasing an allocation.
| Field | Meaning and unit | Sampling | Source |
|---|---|---|---|
Total |
Total memory allocated by the VM, bytes; always 100% | Current | memory() key total |
Process |
Memory currently used by processes, bytes and percent of Total |
Current | memory() key processes_used |
Atom |
Memory currently used by atoms, bytes and percent of Total |
Current | memory() key atom_used |
Binary |
Memory for binaries, bytes and percent of Total |
Current | memory() key binary |
Code |
Memory for loaded code, bytes and percent of Total |
Current | memory() key code |
Ets/N |
ETS memory, bytes and percent of Total; N is the current table count |
Current | memory() key ets, length(ets:all()) |
Persistent Terms/N |
Persistent-term memory in bytes; N is the term count |
Current | persistent_term:info() keys memory, count |
RunQueue |
Runnable normal and dirty-CPU work | Current | statistics(run_queue) |
RunQueue/ErrorLoggerQueue |
Run queue / error_logger mailbox length, when that registered process exists |
Current | statistics(run_queue), process_info(Pid, message_queue_len) |
IO/GC:(Nms), Total/Increments |
N is the configured refresh interval; following values show totals and prior-sample differences, not exact-period rates |
Configured interval / sampled values | Page state |
IO Input, IO Output |
Total bytes through VM Ports / bytes added since the preceding Home sample | Total / refresh increment | statistics(io) |
Gc Count |
Garbage collections / collections added since the preceding Home sample | Total / refresh increment | statistics(garbage_collection) |
Gc Words Reclaimed |
Reclaimed heap words / words added since the preceding Home sample | Total / refresh increment | statistics(garbage_collection) |
Each scheduler row shows its scheduler ID and active-time percentage between two
statistics(scheduler_wall_time) samples. The rows cover the normal and dirty
CPU scheduler IDs returned by OTP, not dirty IO schedulers. observer_cli uses
recon_lib:scheduler_usage_diff/2; values at or above 80% are red.
Only while this same feature is enabled, Sched busy replaces Home's redundant
Version row with N ... / D .... It uses the same two wall-time samples as
the utilization rows: each pool's sum of active-time differences divided by its
sum of total-time differences, for online normal and online dirty-CPU schedulers
respectively. The two percentages are not added together. An absent online pool
shows n/a. The initial and resumed sample shows warming up; topology changes
or invalid counters discard the window, then re-establish a baseline. No
additional wall-time or run-queue sampling is performed to produce the summary.
The CPU window label applies only to BEAM CPU. Scheduler samples and OS
samples are taken at different points in the existing collection cycle and
must not be treated as synchronized windows.
Scheduler busy time is not OS CPU time: it can include lock waits or time while
the OS has scheduled a scheduler thread out. Use it alongside BEAM CPU, not as
a substitute. Switching usage off removes the summary and restores Version;
CPU and RSS continue independently. Pausing does not poll either sampler and
retains the existing enabled/disabled setting; resuming starts fresh windows.
| Field | Meaning and unit | Sampling | Source |
|---|---|---|---|
No, Pid |
Display row and local process identifier | Current | Ranked result |
Name|>Label|>Initial Call |
Registered name, otherwise OTP 27+ process label, otherwise translated initial call | Current | registered_name, proc_lib:get_label/1, proc_lib:translate_initial_call/1 |
Current Function |
Currently executing MFA | Current | process_info(Pid, current_function) |
Memory |
Process memory, bytes | Count: current; window: change | recon:proc_count/2 or recon:proc_window/3 with memory |
BinMemory |
Referenced binary memory, bytes | Count: current; window: change | Recon binary_memory attribute |
Reductions |
Process reductions | Count: total; window: increment | Recon reductions attribute |
TotalHeapSize |
Process total heap words multiplied by VM word size, bytes | Count: current; window: change | Recon total_heap_size attribute |
MsgQueue |
Pending message count | Count: current; window: change | Recon message_queue_len attribute |
Only the selected ranking field uses the count or window value. The companion
Memory, Reductions, and MsgQueue columns are current point-in-time reads.
Window changes are second sample minus first and can be negative. A process
present in only one sample retains that sample's absolute value.
A reduction is a VM scheduling work unit, not elapsed CPU time.
| Input | Action |
|---|---|
ic |
Use recon:inet_count/2 |
iw |
Use a Recon-backed window sample with the page interval |
rc |
Sort by received packet count |
ro |
Sort by received octets |
sc |
Sort by sent packet count |
so |
Sort by sent octets |
cnt |
Sort by total packet count |
oct |
Sort by total octets |
| Row number or Enter | Open the corresponding Port detail |
The page also displays VM input/output deltas from erlang:statistics(io).
Ranked rows cover legacy inet Ports, not every host connection or the OTP
socket registry.
| Field | Meaning and unit | Sampling | Source |
|---|---|---|---|
Byte Input, Byte Output |
Bytes added since the preceding Network redraw | Refresh delta | statistics(io) |
Total Input, Total Output |
Cumulative bytes through VM Ports | Total | statistics(io) |
NO, Port |
Display row and legacy inet Port identifier |
Current | Recon count or window sampling |
recv_cnt, send_cnt, cnt |
Received, sent, and combined packet counts | Count: total; window: delta | inet:getstat/2 through Recon |
recv_oct, send_oct, oct |
Received, sent, and combined bytes | Count: total; window: delta | inet:getstat/2 through Recon |
output, input |
Cumulative bytes written to and read from the Port driver | Total | recon:port_info(Port, io) |
queuesize |
Bytes currently queued by the Port driver, rendered as a raw integer | Current | recon:port_info(Port, memory_used) key queue_size |
memory |
Runtime memory allocated for the Port, bytes | Current | recon:port_info(Port, memory_used) key memory |
Peername(ip:port) |
Remote endpoint or formatted socket error | Current | inet:peername/1 |
The first iw redraw uses count mode; later redraws use the configured window.
For Ports present in both samples, all ranked metric columns use deltas from the
same window. A Port present in only one sample retains that sample's absolute
values. One-direction modes remain sorted by the selected direction. Port
input and output totals appear under their matching headings.
The Ports page excludes inet Ports already represented on Network.
| Input | Action |
|---|---|
qs |
Sort by queue size |
m |
Sort by memory |
| Row number | Open Port detail |
In Port detail, H opens Home, N opens Network, O returns to Ports, P
keeps the current detail, and an integer at least 1000 changes the refresh
interval.
| Field | Meaning and unit | Source |
|---|---|---|
NO |
Display row | Current page |
Id |
Runtime Port index | port_info(Port, id) |
Connected |
Process connected to and controlling the Port | port_info(Port, connected) |
Name |
Port driver name | port_info(Port, name) |
Controls |
Driver control name, falling back to Name |
port_info(Port, controls) |
Slot |
Runtime Port-table slot; undefined when unsupported |
port_info(Port, slot) |
Queue |
Current queued bytes, rendered as a raw integer | port_info(Port, queue_size) |
Memory |
Current runtime memory for the Port, bytes | port_info(Port, memory) |
Parallel |
Whether the Port uses parallelism | port_info(Port, parallelism) |
Locking |
Locking mode, such as port_level or driver_level |
port_info(Port, locking) |
Mon/By |
Count of outbound monitors held by the Port / count of entities monitoring the Port | port_info(Port, monitors), port_info(Port, monitored_by) |
The list is a current snapshot of erlang:ports/0 and excludes Ports whose
name or control name is tcp_inet, udp_inet, or sctp_inet.
| Field | Meaning and unit | Source |
|---|---|---|
port, id, name |
Port term, runtime index, and driver name | recon:port_info/1 |
queue_size |
Current queued bytes, rendered as a raw integer; red when nonzero | recon:port_info/1 category memory_used |
input, output |
Cumulative bytes read from and written to the Port | recon:port_info/1 category io |
connected |
Controlling process | recon:port_info/1 category signals |
memory |
Runtime memory allocated for the Port, bytes | recon:port_info/1 category memory_used |
os_pid |
Associated external OS process ID, when one exists | recon:port_info/1 category meta |
controls |
Runtime control name, falling back to the Port name | port_info(Port, controls) |
slot, parallelism, locking |
Runtime-specific Port properties; unsupported properties are undefined |
port_info/2 |
Links(N), Monitors(N), Monitored by(N) |
Full link, outbound-monitor, and inbound-monitor counts; at most the first 30 values | Recon signals plus port_info(Port, monitored_by) |
sockname, peername |
Local and remote legacy-inet endpoints |
recon:port_info/1 category type |
Legacy-inet detail adds current statistics from inet:getstat/1 through
Recon. Transfer counters and packet-size aggregates are cumulative;
send_pend is a current gauge.
| Field | Meaning and unit |
|---|---|
recv_cnt, send_cnt |
Packets received and sent |
recv_oct, send_oct |
Bytes received and sent |
recv_max, send_max |
Largest received and sent packet, bytes |
recv_avg, send_avg |
Average received and sent packet size, bytes |
recv_dvi |
Average received-packet-size deviation, bytes |
send_pend |
Bytes currently pending send; rendered as a raw integer |
The Options block attempts a fixed inet:getopts/2 allowlist: active,
broadcast, buffer, bind_to_device, delay_send, deliver, dontroute,
exit_on_close, header, high_msgq_watermark, high_watermark,
low_msgq_watermark, low_watermark,
ipv6_v6only, keepalive, linger, mode, netns, nodelay, packet,
packet_size, priority, read_packets, recbuf, reuseaddr, send-timeout
options send_timeout and send_timeout_close, show_econnreset, sndbuf,
tos, and tclass. Unsupported options are shown explicitly.
The Sockets page reads the OTP socket registry. A missing socket API produces an unavailable state.
| Input | Sort key |
|---|---|
io |
Read plus write bytes |
rb |
Read bytes |
wb |
Write bytes |
pk |
Packets |
wt |
Waits |
fl |
Failures |
mx |
Maximum packet value |
ac |
Accept activity |
id |
Socket ID |
fd |
File descriptor |
ow |
Owner |
dm |
Domain |
tp |
Type |
pt |
Protocol |
A row number opens socket detail; K returns to the Sockets list. Counter
sorting uses deltas after the first refresh. Identity sorting uses current
metadata.

The General block comes from socket:info/0, with num_sockets and
num_monitors taken from socket:number_of/0 and
socket:number_of_monitors().
| Field | Meaning |
|---|---|
iov_max |
Maximum number of IO vectors supported by the runtime |
num_cnt_bits |
Width of the socket counter representation |
num_sockets, num_monitors |
Registry-known socket and socket-monitor counts |
num_dinet, num_dinet6, num_dlocal |
Socket counts by domain |
num_tstreams, num_tdgrams, num_tseqpkgs |
Socket counts by type |
num_pip, num_psctp, num_ptcp, num_pudp |
Socket counts by protocol |
The page enumerates socket:which_sockets/0; sockets created with registry use
disabled are not included.
| Field | Meaning and unit | Sampling | Source |
|---|---|---|---|
NO, Socket |
Display row and socket:to_list(Socket) identifier |
Current | Socket registry |
Owner(ow) |
Controlling process | Current | socket:info(Socket) key owner |
Endpoint |
Local endpoint -> remote endpoint |
Current | socket:sockname/1, socket:peername/1 |
Kind |
domain/protocol/type |
Current | socket:info(Socket) |
State |
Read and write state lists | Current | socket:info(Socket) keys rstates, wstates |
Read rb |
read_byte, bytes |
First redraw: total; later: delta | Socket counters |
Write wb |
write_byte + sendfile_byte, bytes |
First redraw: total; later: delta | Socket counters |
Pkt/Acc |
Read + write + sendfile packet count / successful accept count | First redraw: total; later: delta | Socket counters |
Wait |
Accept + read + write + sendfile wait count | First redraw: total; later: delta | Socket counters |
Fail |
Accept + read + write + sendfile failure count | First redraw: total; later: delta | Socket counters |
MaxPkt |
Largest current read, write, or sendfile packet maximum, bytes | Current | Socket counters |
Counter decreases are clamped to zero. Sorting by ac uses
acc_success + acc_tries, while the visible acceptance value in Pkt/Acc is
acc_success only. Changing the sort, interval, or page restarts the list
worker, so the next redraw again shows cumulative counters before later
redraws become deltas.
| Section | Fields | Source and behavior |
|---|---|---|
Overview |
id, owner, fd, domain, type, protocol, read_state, write_state, monitored_by |
Current socket:info/1, socket:getopt(Socket, otp, fd), and socket:monitored_by(Socket) |
Net |
local_address, remote_address |
Current socket:sockname/1 and socket:peername/1 |
Counters |
acc_tries, acc_waits, acc_fails, acc_success, read_tries, read_waits, read_fails, read_byte, read_pkg, read_pkg_max, write_tries, write_waits, write_fails, write_byte, write_pkg, write_pkg_max, plus runtime additions |
Current cumulative socket:info/1 counters, not list deltas |
Options |
Supported socket, ip/ipv6, and matching tcp/udp/sctp options |
Dynamic socket:supports/2 set read through socket:getopt/2 |
read_byte, write_byte, read_pkg_max, and write_pkg_max are byte-formatted;
the other preferred counters are counts. Additional runtime counters follow
alphabetically. Unsupported, disconnected, and unimplemented options are
identified rather than omitted.
The System page shows current snapshots, except distribution packet rates, which use successive samples and their actual elapsed monotonic time.
| Group | Field | Meaning and unit | Source |
|---|---|---|---|
| System | System Version, Erts Version |
OTP release and ERTS version | system_info(otp_release), system_info(version) |
| System | Emulator Wordsize, Process Wordsize |
External and internal VM word sizes, bytes | system_info({wordsize, external/internal}) |
| System | Thread Support, Async thread pool size |
Thread support flag and async-thread count | system_info(threads), system_info(thread_pool_size) |
| System | compiled for |
Target system architecture | system_info(system_architecture) |
| CPU | Logical CPU's, Online Logical CPU's, Available Logical CPU's |
Logical processor counts | Corresponding system_info/1 keys |
| CPU | Schedulers, Online schedulers |
Configured and online normal scheduler counts | system_info(schedulers), system_info(schedulers_online) |
| CPU | Available schedulers |
Online schedulers when multi-scheduling is enabled; otherwise 1 |
system_info(multi_scheduling), system_info(schedulers_online) |
| Memory | Total, Processes, Atoms, Binaries, Code, Ets |
Bytes and percent of total | Corresponding memory() keys |
| Statistics | BEAM CPU, CPU window |
Same OS user + system CPU window semantics as Home; each view has its own baseline | Target OS counters and monotonic time |
| Statistics | BEAM RSS, BEAM VSZ |
Current resident memory with signed window change; virtual address-space size is separate, not physical memory | Linux proc counters; macOS ps |
| Statistics | Total IOIn, Total IOOut |
Cumulative bytes through VM Ports | statistics(io) |
System Processes and Atoms use the allocated-memory keys processes and
atom; Home deliberately uses the used-memory keys processes_used and
atom_used.
| Field | Meaning and unit | Source |
|---|---|---|
Processes, Ports, Atoms, ETS |
Current count / limit and percent used | Corresponding system_info/1 count and limit keys |
Dirty CPU schedulers, Online dirty CPU schedulers |
Configured and online dirty-CPU scheduler counts | system_info/1 |
Dist busy limit (bytes) |
Configured distribution busy limit in bytes, rendered as a raw integer | system_info(dist_buf_busy_limit) |
Modules |
Loaded module count | length(code:all_loaded()) |
Run Queue |
Runnable normal and dirty-CPU work | statistics(run_queue) |
Rows cover binary_alloc, driver_alloc, eheap_alloc, ets_alloc,
fix_alloc, ll_alloc, sl_alloc, std_alloc, and temp_alloc.
| Field | Meaning and unit | Source |
|---|---|---|
Allocator Type |
Allocator family | Fixed list above |
Current Mbcs, Current Sbcs |
Current average block size in multi- and single-block carriers, bytes | recon_alloc:average_block_sizes(current) |
Max Mbcs, Max Sbcs |
Average block sizes derived from Recon's max block-count and block-size values, bytes |
recon_alloc:average_block_sizes(max) |
Current SbcsToMbcs, Max SbcsToMbcs |
Dimensionless sums of numeric per-instance SBCS-to-MBCS ratios grouped by allocator family | recon_alloc:sbcs_to_mbcs/1 |
| Field | Meaning and unit | Source |
|---|---|---|
Node |
Connected distributed node | net_kernel:nodes_info() |
State, Type |
Connection state and type, not a health assessment | net_kernel:nodes_info() |
Rx pkt/s, Tx pkt/s |
Received/sent distribution packets per second, not application messages or byte throughput | Deltas of the first two counters in dist_get_stat/1, divided by elapsed seconds |
Pending pkts |
Pending output packets at this sample | Fourth element of dist_get_stat/1 |
Recent pkts (old>new) |
Up to three consecutive pending-packet samples, oldest to newest | Current connection's sampling history |
Address |
Distribution address and port | net_kernel:nodes_info() |
Rates show - on the first sample, after reconnection, counter reset, or an
invalid time interval. A missing sample breaks continuity: recovery starts a
new baseline rather than interpolating across the gap. Unavailable packet
statistics show N/A, never a fabricated zero. Leaving the System page resets
its sampling history. Changing the refresh interval uses actual elapsed time.
If a history does not fit its column, ... > latest preserves the newest
observation and explicitly elides the older samples.
The packet statistics use OTP internals and are capability-checked. Disabled distribution, no connected nodes, and unavailable distribution information produce explicit sentinel rows. A disappearing peer does not crash the page.
Pending packets and their history are observations, not capacity utilization or a health score. Nonzero samples do not establish continuous blocking between samples. The busy limit is an independent byte-valued configuration in the runtime limits section; packet counts are never divided by it. The TUI does not install a system monitor or infer backpressure events. The CLI's controller queue bytes remain separate context-only observations, not the same metric as pending packets.
| Field | Meaning | Source |
|---|---|---|
Instance / IN |
mseg_alloc cache instance |
recon_alloc:cache_hit_rates/0 |
Hits |
Memory-segment cache hits | Current cumulative counter |
Calls |
Memory-segment cache lookups | Current cumulative counter |
Hit Rate |
Hits divided by calls | recon_alloc:cache_hit_rates/0 |
Both table pages accept:
| Input | Action |
|---|---|
m |
Sort by memory |
s |
Sort by object count |
F / B or pd / pu |
Change page |
Mnesia also accepts hide to toggle system tables. These views report metadata only; they do not read table contents.
All values are current ets:all/0 and ets:info/1 metadata.
| Field | Meaning and unit | Source |
|---|---|---|
Table Name |
Table name recorded by ETS | ets:info(Table, name) |
Size |
Stored object count | ets:info(Table, size) |
Memory |
Table memory words multiplied by VM word size, displayed as bytes | ets:info(Table, memory), system_info(wordsize) |
Type |
set, ordered_set, bag, or duplicate_bag |
ets:info(Table, type) |
Protection |
public, protected, or private access mode |
ets:info(Table, protection) |
KeyPos |
Tuple element used as the key | ets:info(Table, keypos) |
Write/Read |
Write-concurrency / read-concurrency settings | ets:info/1 |
Owner Pid |
Owner PID | ets:info(Table, owner) |
If a table disappears between enumeration and metadata collection, the current renderer can fail that redraw. Sorting uses raw memory words or object count.
| Field | Meaning and unit | Source |
|---|---|---|
Name |
Table name | Table ID from mnesia:system_info(tables) |
Memory |
Table memory in bytes; word-valued storage types are multiplied by VM word size | mnesia:table_info(Table, memory), system_info(wordsize) |
Size |
Stored record count | mnesia:table_info(Table, size) |
Type |
Mnesia table type | mnesia:table_info(Table, type) |
Storage |
Local storage type such as ram_copies, disc_copies, or disc_only_copies |
mnesia:table_info(Table, storage_type) |
Owner |
Owner PID of the local schema ETS table |
ets:info(schema, owner) |
Index |
Configured index positions | mnesia:table_info(Table, index) |
Reg_name |
Registered name of the local schema owner | process_info(Owner, registered_name) |
The schema table is always hidden; hide toggles an additional fixed list of
legacy system tables. OTP reports memory in words for ram_copies and
disc_copies, but in bytes for disc_only_copies; only the word-valued forms
are multiplied by VM word size.
The App page aggregates process resources by application.
| Input | Sort key |
|---|---|
p |
Process count |
m |
Memory |
r |
Reductions |
mq |
Message queue length |
F / B |
Next or previous page |
| Field | Meaning and unit | Sampling and source |
|---|---|---|
Id |
Display row | Current page |
App |
Application name; no_group contains unmatched processes |
Application set and running supervisors from application:info(); process association from process_info(Pid, group_leader) |
ProcessCount(p) |
Processes associated with the application | Current sum |
Memory(m) |
Sum of process memory, bytes | Current process_info(Pid, memory) values |
Reductions(r) |
Sum of cumulative process reductions | Current process_info(Pid, reductions) values |
MsgQ(mq) |
Sum of pending messages | Current process_info(Pid, message_queue_len) values |
Status |
Loading, Loaded, Starting, Started, StartPFalse, or Unknown |
application:info() |
version |
Loaded application version or unknown |
application:info() |
Processes are associated through application group leaders. All values and sorts are current snapshots; the page does not calculate interval deltas.
Home rows and plugin PID rows without a configured handler open Process detail.
| View | Key | Contents |
|---|---|---|
| Process Info | P |
Metadata, signals, memory, and reduction history |
| Messages | M |
Message list when queue length is at most 10,000 |
| Dictionary | D |
Process dictionary |
| Current Stack | C |
Up to 30 current stack frames |
| State | S |
recon:get_state(Pid, 2500) rendered through the configured formatter |
H returns Home. B returns to the source page: Home or the plugin sheet. An
integer at least 1000 changes the detail refresh interval. State is a static
capture in the built-in pager.

The primary view requests only the displayed process_info/2 fields; it does
not fetch the process dictionary or current stacktrace in the background.
| Field | Meaning and unit | Source |
|---|---|---|
registered_name |
PID, followed by /name when registered |
Recon meta |
initial_call |
MFA that started the process | Recon location |
group_leader |
Process group leader PID | Recon meta |
status |
Current scheduler-visible process state | Recon meta |
priority |
Process priority | process_info(Pid, priority) |
catchlevel |
Number of active catches | process_info(Pid, catchlevel) |
suspending |
Total suspending entries and at most the first three values | process_info(Pid, suspending) |
error_handler |
Module used for unresolved function calls | process_info(Pid, error_handler) |
msg_queue_len |
Pending message count; red when nonzero | Recon memory_used |
heap_size |
Current heap words multiplied by VM word size, bytes | Recon memory_used |
total_heap_size |
Total allocated heap words multiplied by VM word size, bytes | Recon memory_used |
trap_exit |
Whether exit signals are converted to messages | Recon signals |
stack_size |
Current stack words multiplied by VM word size, bytes | process_info(Pid, stack_size) |
binary_refs |
Referenced-binary entry count / sum of referenced binary sizes | process_info(Pid, binary) |
min_bin_vheap_size |
Minimum virtual binary heap words multiplied by VM word size, bytes | Recon garbage-collection data |
min_heap_size |
Minimum heap words multiplied by VM word size, bytes | Recon garbage-collection data |
fullsweep_after |
Minor collections allowed before a full-sweep collection | Recon garbage-collection data |
minor_gcs |
Minor collections since the last full sweep | Recon garbage-collection data |
Process status is one of the states returned by OTP, including exiting,
waiting, running, runnable, garbage_collecting, or suspended.
Links(N), Monitors(N), and MonitoredBy(N) show the full relationship
counts and at most the first 30 values. Links are bidirectional process/Port
links; Monitors are monitors created by the process; MonitoredBy lists
entities monitoring it. The Reductions and Memory histories hold up to 20
point-in-time samples; reductions are cumulative and memory is current bytes.
| View | Data source and boundary |
|---|---|
| Messages | Reads message_queue_len first. An empty queue is not fetched; queues above 10,000 return too_large; otherwise messages come from recon:info(Pid, messages) and use the configured term formatter. |
| Dictionary | Reads the current process dictionary and entry count with process_info(Pid, dictionary) and uses the configured term formatter. |
| Current Stack | Reads process_info(Pid, current_stacktrace) and shows at most 30 MFA plus file:line frames. |
| State | Takes one static recon:get_state(Pid, 2500) capture and uses the configured term formatter. |
Messages, Dictionary, and State are collected and formatted in a monitored
worker on the observed node. The worker has a five-second deadline and a
512 * 1024-word heap cap that includes shared binaries. Terms are refused
above 64 KiB of external representation or structural depth 32. Formatter
output is refused when the final rendered detail, including view prefixes,
exceeds 65,536 characters or 64 KiB of UTF-8; every refusal displays
too_large. These limits bound the helper and retained output, but the VM can
still do transient work while copying a requested term, and a delivered
system_get_state request can outlive its caller timeout.
Pager input is:
| Input | Action |
|---|---|
F or j |
Next page |
B or k |
Previous page |
q or Q |
Quit the TUI from the process-state pager |
When B is reserved for returning to a plugin, use k for the previous pager page.
Application configuration supplies the Plugin menu and column shortcuts. Built-in input is:
| Input | Action |
|---|---|
| Plugin shortcut | Select a plugin |
| Column shortcut | Sort by that column |
| Row number | Select that row |
| Enter | Open the remembered row |
F / B |
Next or previous page |
Integer at least 1000 |
Change plugin refresh interval |
H |
Return Home |
q |
Quit |
See TUI plugins for callback, configuration, sorting, pagination, row-handler, and formatter contracts.
Main views clear the screen once, then redraw from the cursor origin without accumulating output. A view schedules its next refresh after collection. Window modes first sample for the configured interval, so collection and rendering add to the wall-clock cycle.
Home pause stops collection until resumed. Process state does not auto-refresh. Port and socket detail views render a dead or unavailable state when the selected resource disappears. Process detail renders a dead notice, but a shorter redraw can leave older rows visible.